 January 2022
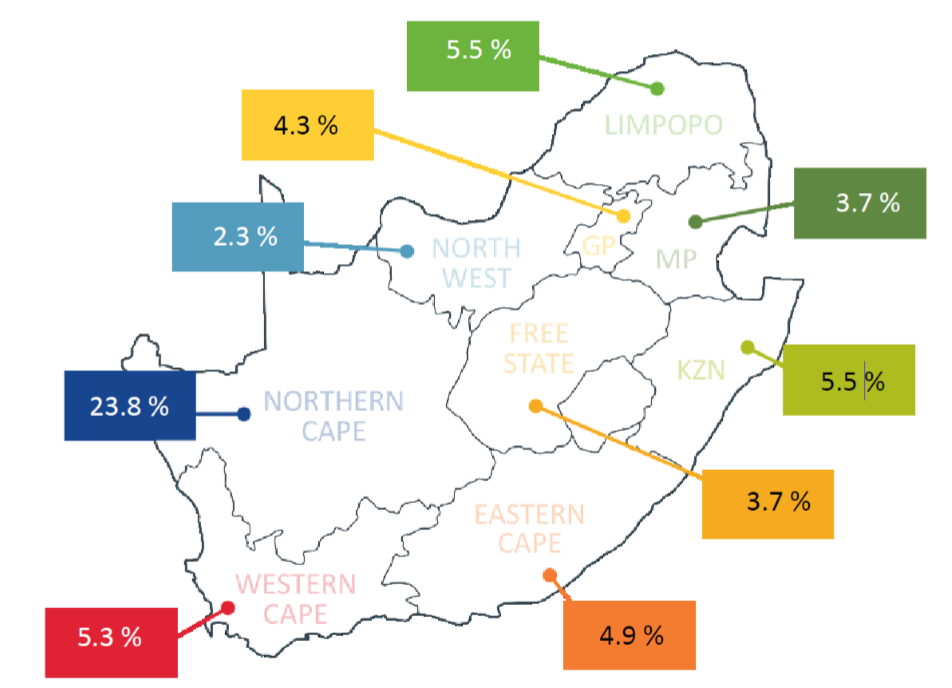
National year-on-year house price inflation is at 4.35%, marking a 4th consecutive month of a 5%-or-under growth in prices. Inflation remained steady in the Eastern Cape, Gauteng, Limpopo and Mpumalanga; increased in the North West, Northern Cape and Western Cape; and decreased in the Free State and KwaZulu-Natal. Prices in the Low Value segment continue to outgrow those in the higher-value segments. The inflation rate for this segment is currently at 9%, almost double that of the Mid Value segment at 4.9%.
December 2021 National year-on-year house price inflation is at 4.6%, marking a third consecutive month under the 5% growth mark. Inflation grew or remained steady in most provinces, with the exception of Mpumalanga which saw a slight decrease. Prices in the Low Value segment continue to outgrow those in the higher value segments. The current inflation rate for this segment is currently at 9.6%, almost double that of the Mid Value segment (5.1%).
 November 2021
National year-on-year house price inflation is at 4.7%, marking a third consecutive month of 5%-or-under growth. Inflation across the provinces is a bit of a mixed bag, with the Eastern Cape, Free State, Gauteng and Limpopo all trending down, KwaZulu-Natal, the North West and Western Cape on the up, and Mpumalanga and the Northern Cape remaining unchanged from last month. Inflation in the Low Value segment continues to outgrow that of its higher value counterparts, with prices currently growing at 10.4%, almost double the growth of the Mid Value segment (5.3%).
October 2021 Inflation continues to grow across most of the provinces, with the exceptions being the North West which has come in lower than last month, and Mpumalanga and KwaZulu-Natal which have both remained steady. Inflation in the Low Value segment continues to outgrow that of its higher value counterparts, with prices currently growing at 10.7%, almost double the growth of the Mid Value segment (5.4%).
September 2021 National year-on-year house price inflation is at 4.89%, dipping below the 5% mark for the first time since March. Inflation continues to grow across most of the provinces, with the exceptions being Limpopo which has again come in lower than last month, and Mpumalanga and the North West which have both remained steady.
August 2021 National year-on-year house price inflation is at 5.03%, marginally down from the five-year record high recorded in May and June. Inflation has been rallying up across all nine provinces except for Limpopo which has experienced a slight drop-off from last month. Inflation in the Low Value segment continues to outgrow that of its higher value counterparts, with prices currently growing at 11.2%, more than four percentage points ahead of the Mid Value segment (6.4%).
 July 2021
Inflation has been rallying up across all provinces except the Western Cape which corrected for a while and is now slowly catching up to the rest.
June 2021 Residential property price growth continues to accelerate with all provincial indices in an upward trajectory. This rolls up to an overall national inflation of 4.9%, a 0.3% increase from last month.
May 2021 Annual house price inflation was recorded at 4.6% at the end of April 2021, another positive month-to-month increase. We continue to see a positive impact of the favourable interest rates across all segments.
 April 2021
The historically low interest rates have had an overall positive impact on the property market from a performance perspective where we now see most of our provinces breaking above their five-year highs.
March 2021 This signifies yet another positive increase from the previous month.
February 2021 Contrary to expectations housing prices did not crash during the year. In fact, the property market recovered.
January 2021 A few general observations can be made about the final inflation figure for 2020. Contrary to expectations housing prices did not crash during the year.
 December 2020
Gauteng is currently growing at 1.4% while Limpopo and Eastern Cape buck the trend growing at more than 5%.
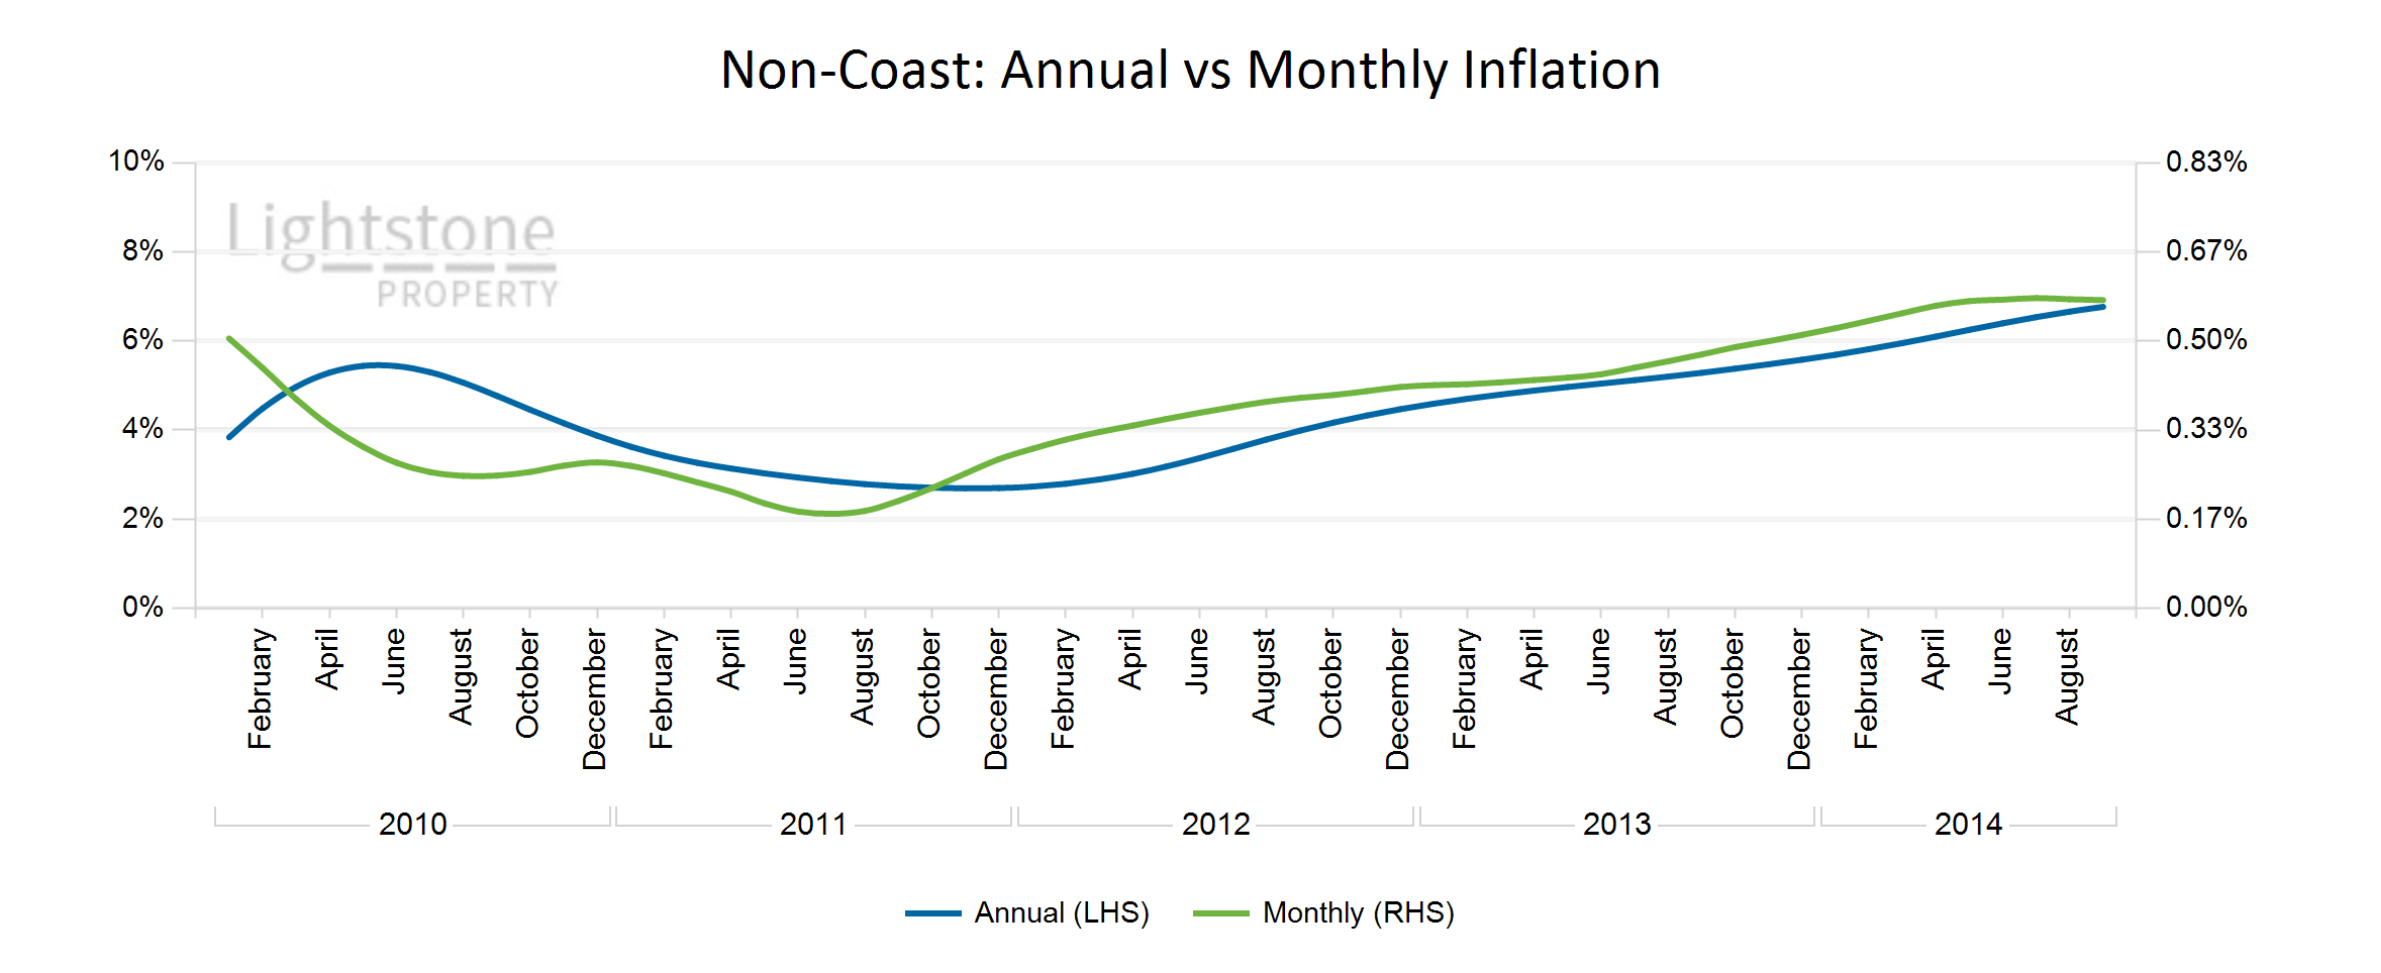
November 2020 Among our major municipalities the coastal municipalities are generally performing better than those inland and this relationship extends to all coastal and inland properties as shown by their respective indices.
October 2020 Gauteng and Free State are currently the least performing provinces with current inflation rates below 1%, making it their ten-year record low.
September 2020 Despite the general slowdown at provincial level The Eastern Cape, Kwazulu-Natal and Mpumalanga province have been growing at increasing rates over the past year to an extent that they now lead the provincial growth with rates currently above 5% per annum.
 August 2020
The Low and Mid value segments continue to buck the market trend by growing by more than 5% annually while the High and Luxury segments are inflating at a lower rate below 2% per annum.
 July 2020
Despite stable growth in the mid and low value segment, house price in the high and luxury segment continues to decrease. This decrease in the higher segments is due primarily to persistent weak economic growth, and uncertainty regarding future interest rates due to the consistent downgrade of the country currently at junk status.
 June 2020
Looking at the provincial indices it is evident the market has consolidated in the 4% zone for provinces with a coastline and 1% for those further inland. Mpumalanga is the only exception among the latter and is currently growing at 4.8% per annum above both ranges.
 May 2020
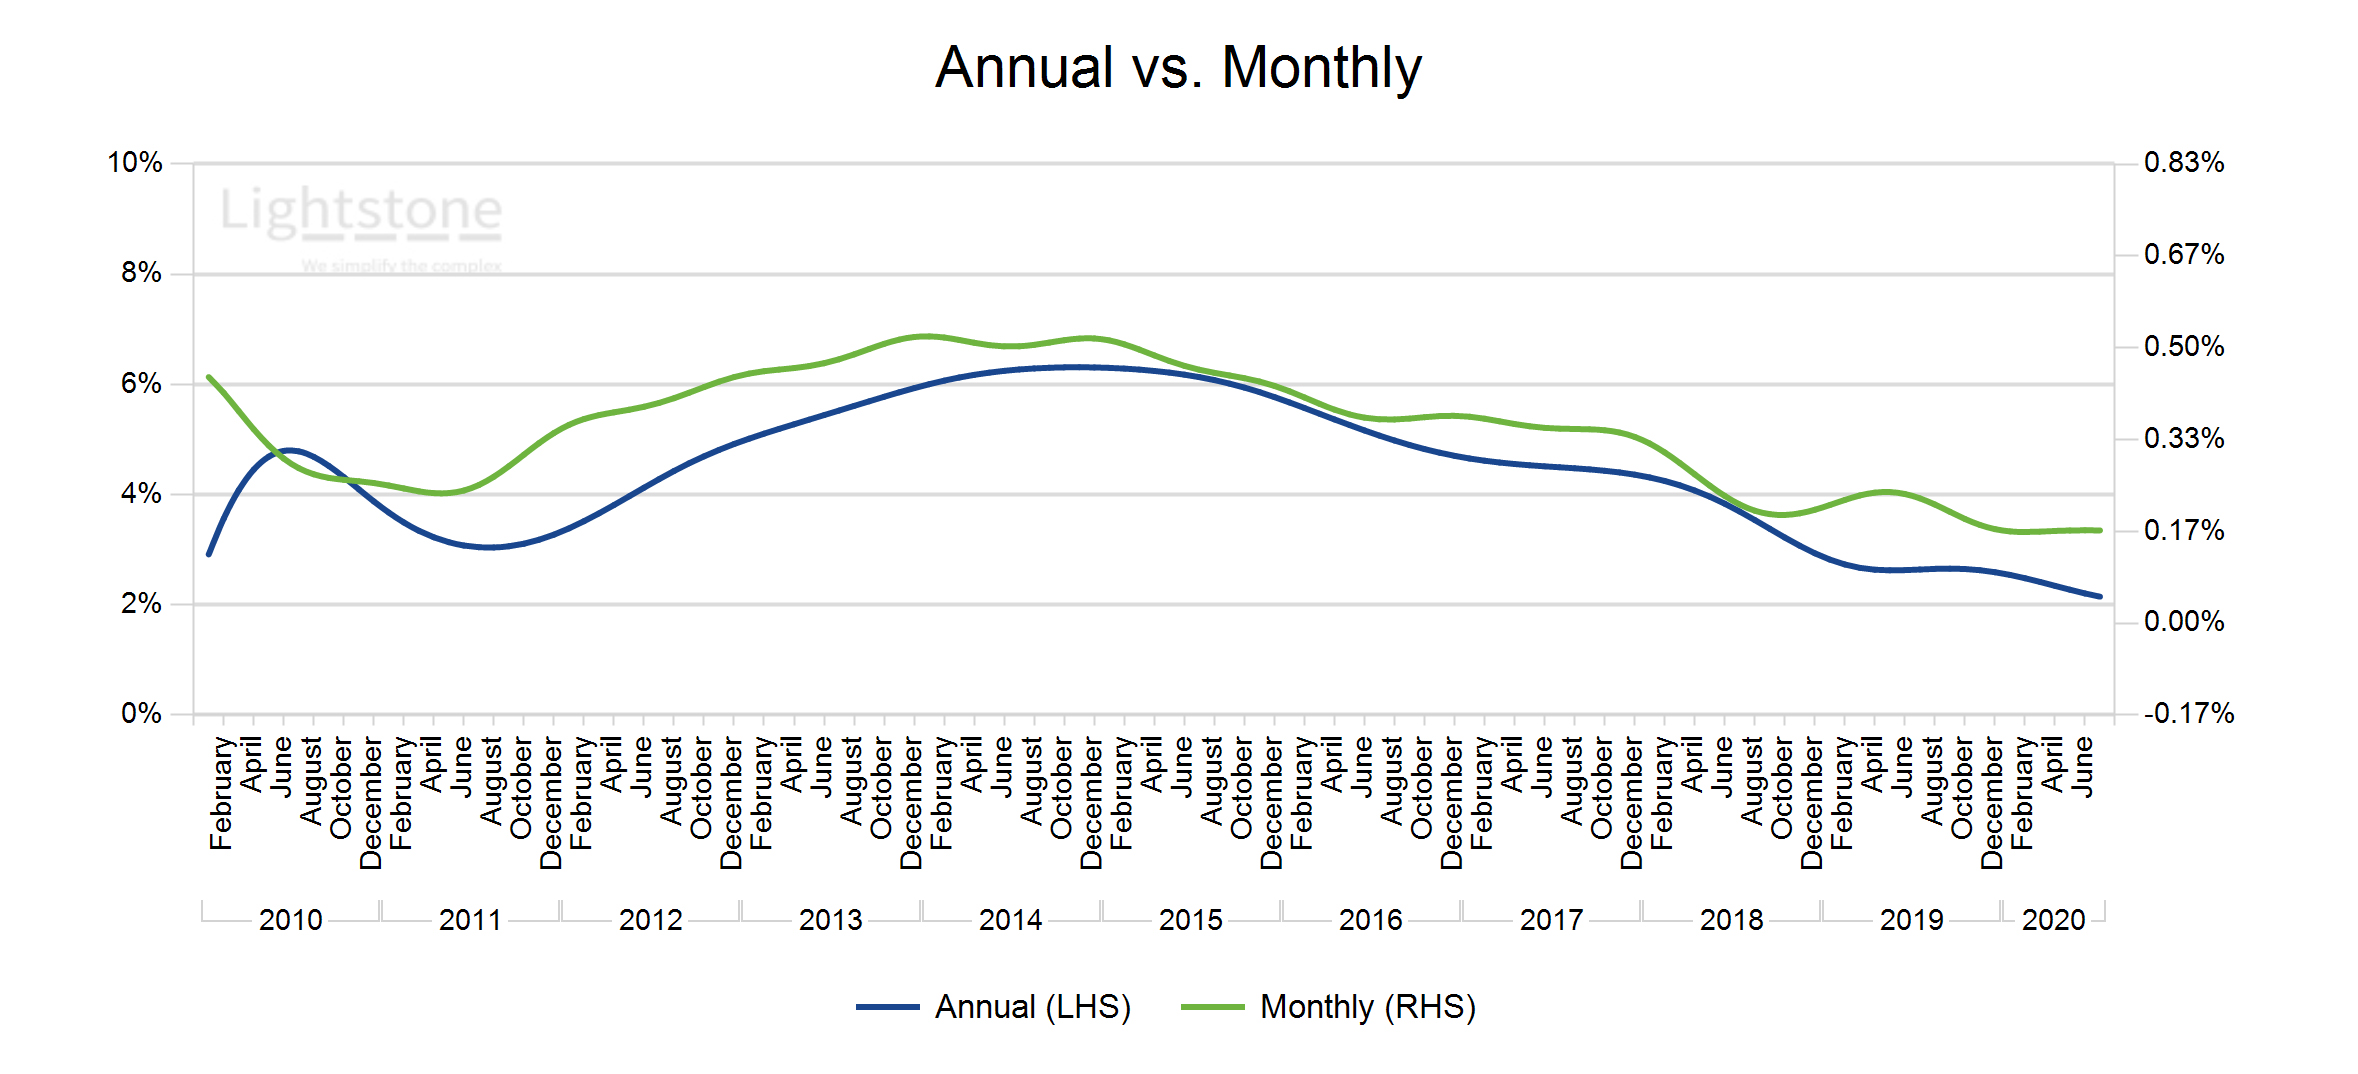
National house price inflation was recorded at 2.4% as at the end of April 2020. This figure has been slowly declining after it peaked at 6.3% end of 2014 mainly due to reduced growth in the luxury and high value segment. House price inflation in the mid and low value segment has been ranging in the 5% and 10% regions respectively.
 March 2020
National house price inflation peaked at 6.35% per annum in 2014 during the market's recovery following the 2007-2008 crash and has been slowly decreasing thereafter closing at a five-year low of 1.7% in 2019.We expect the market to remain in consolidation with a good chance of lesser growth and activity in 2020. All
 January 2020
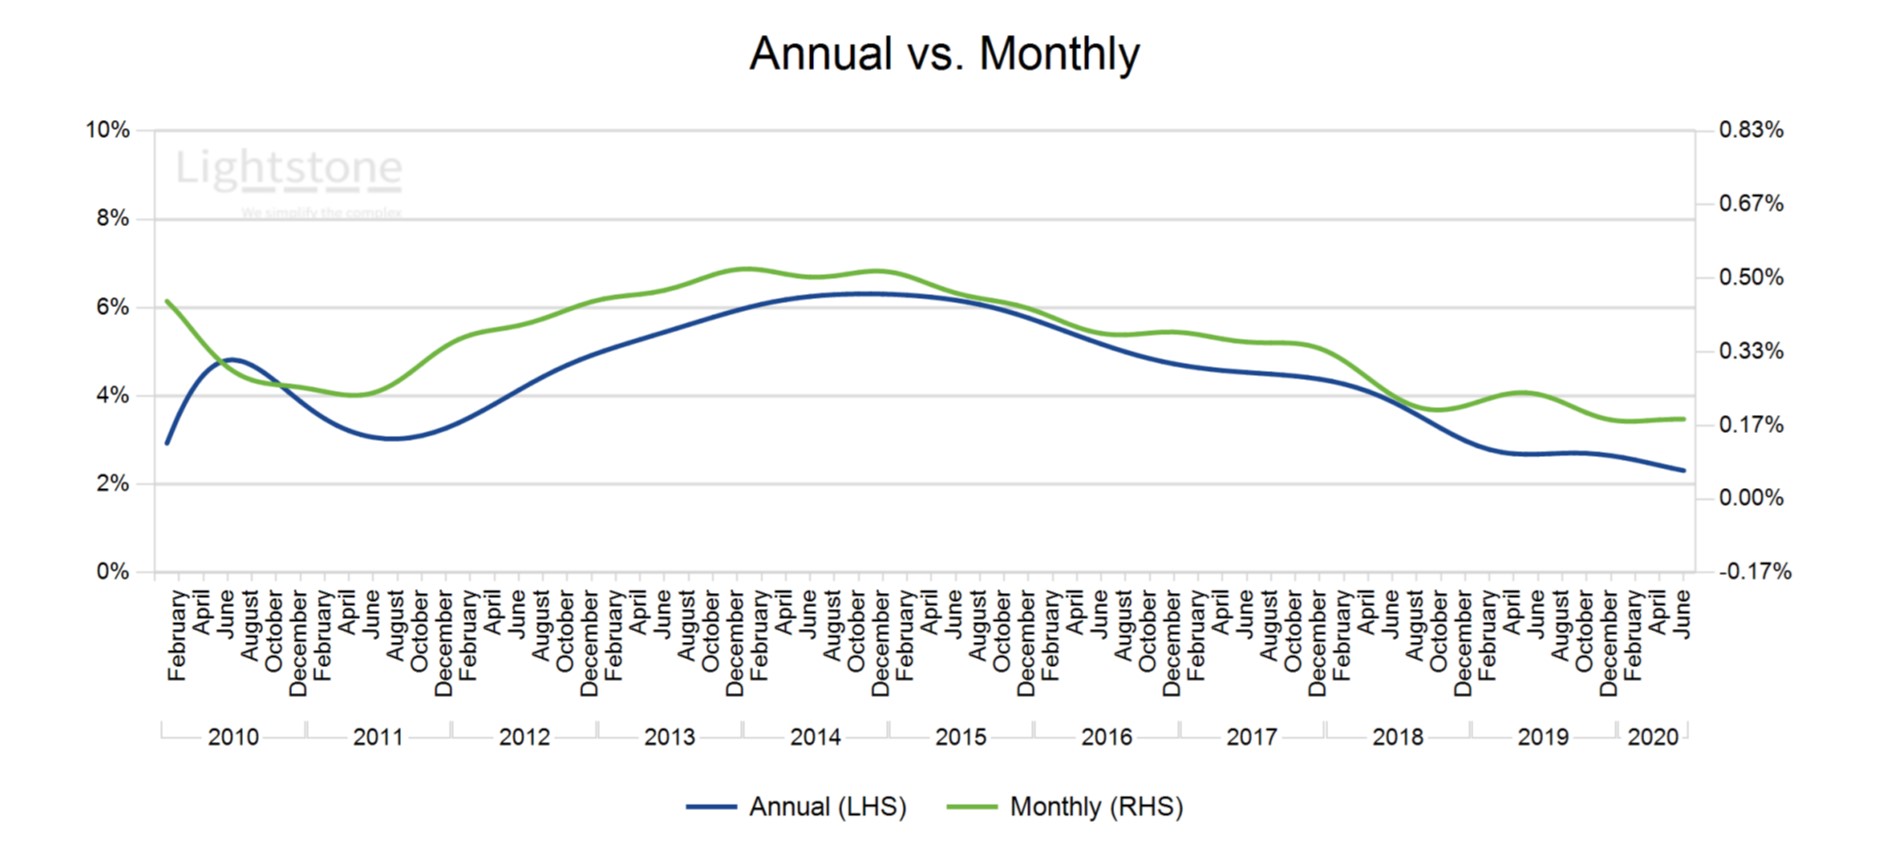
The residential property market has been in consolidation for a while now through the presently slow economy. In 2019 the market closed with an annual inflation rate of only 1.7% at national level.
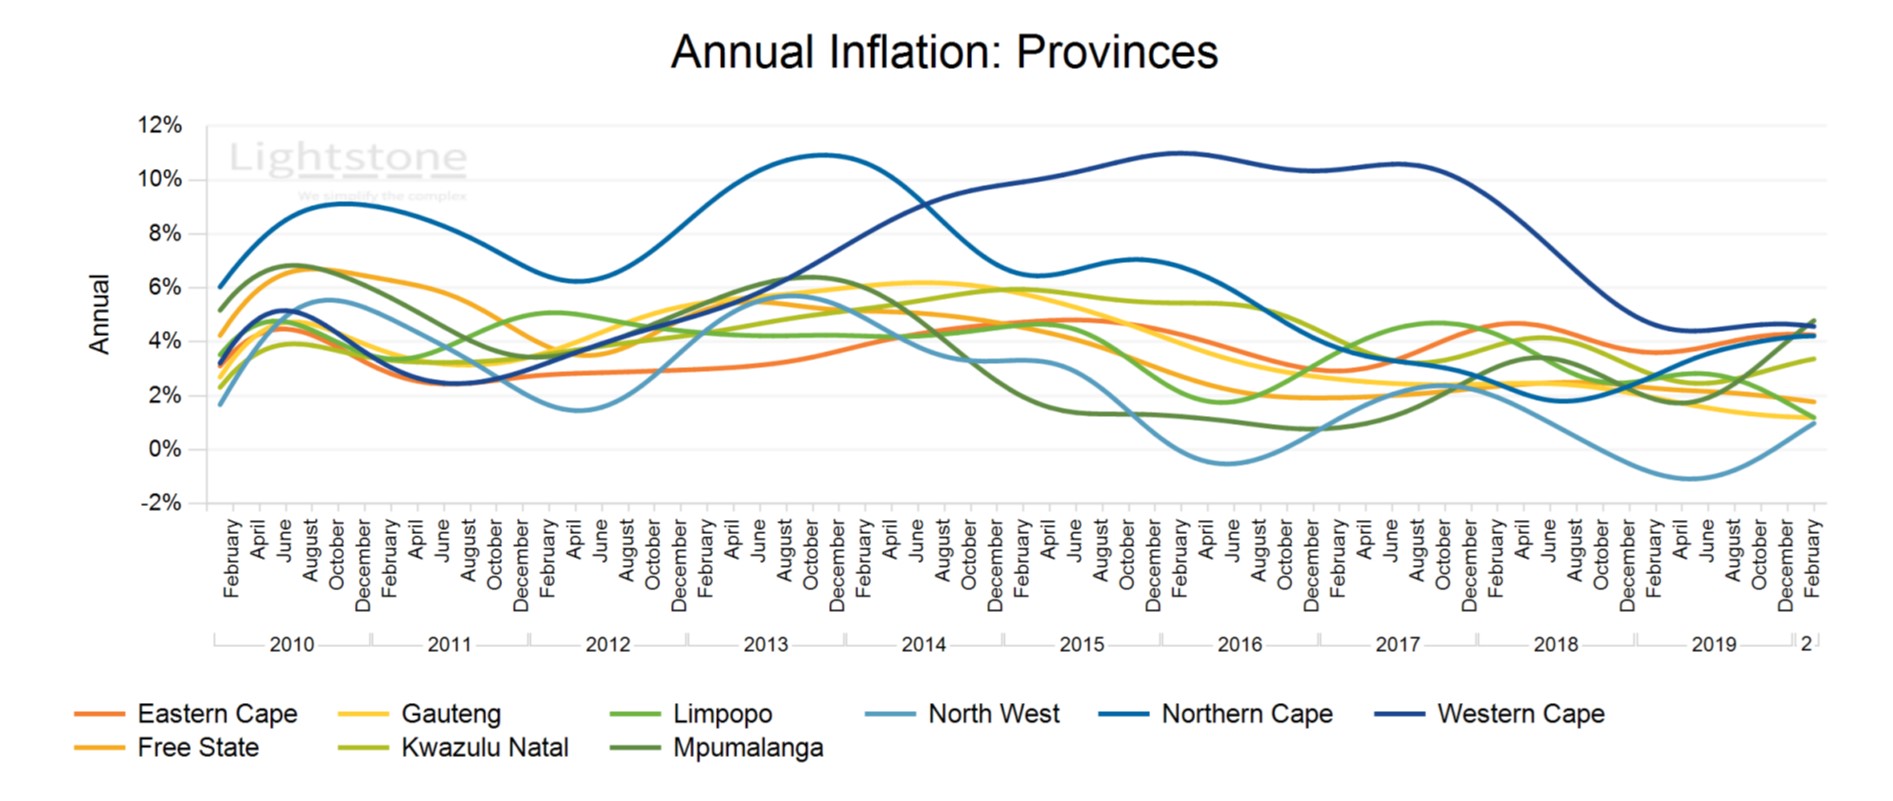
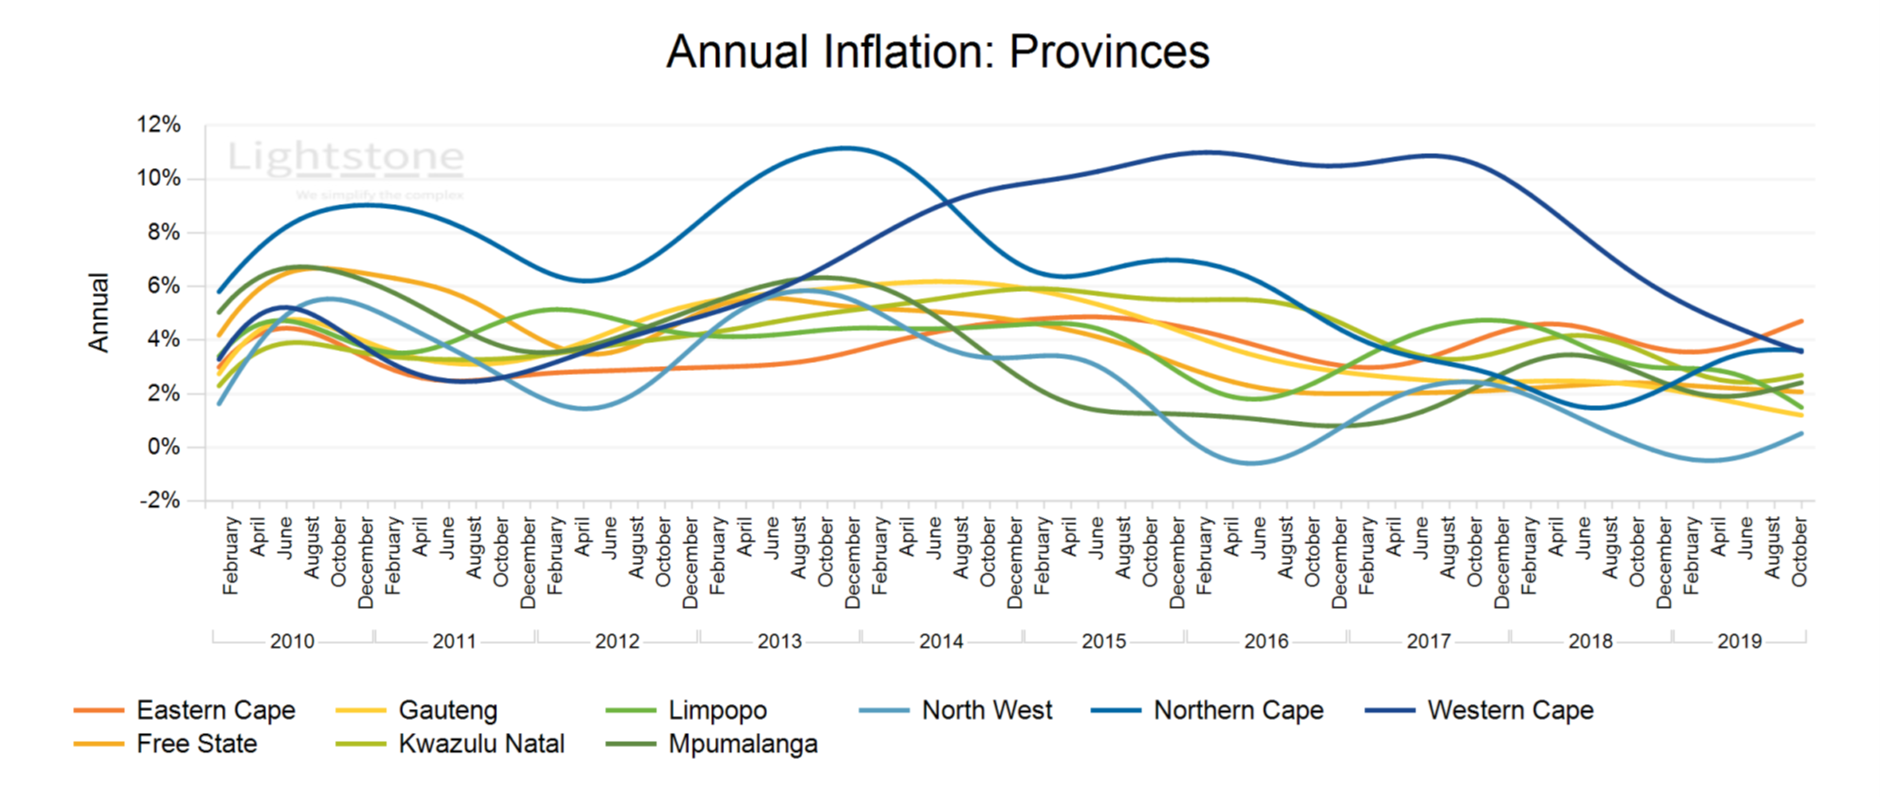
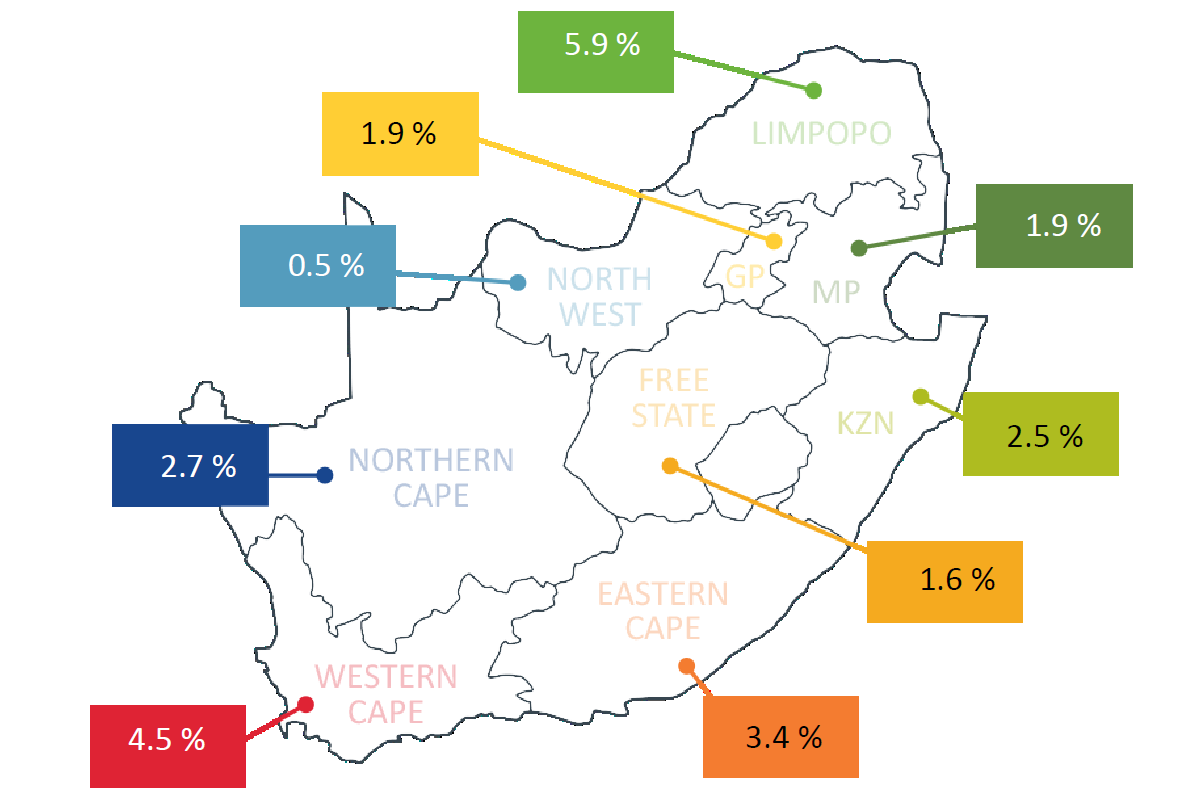
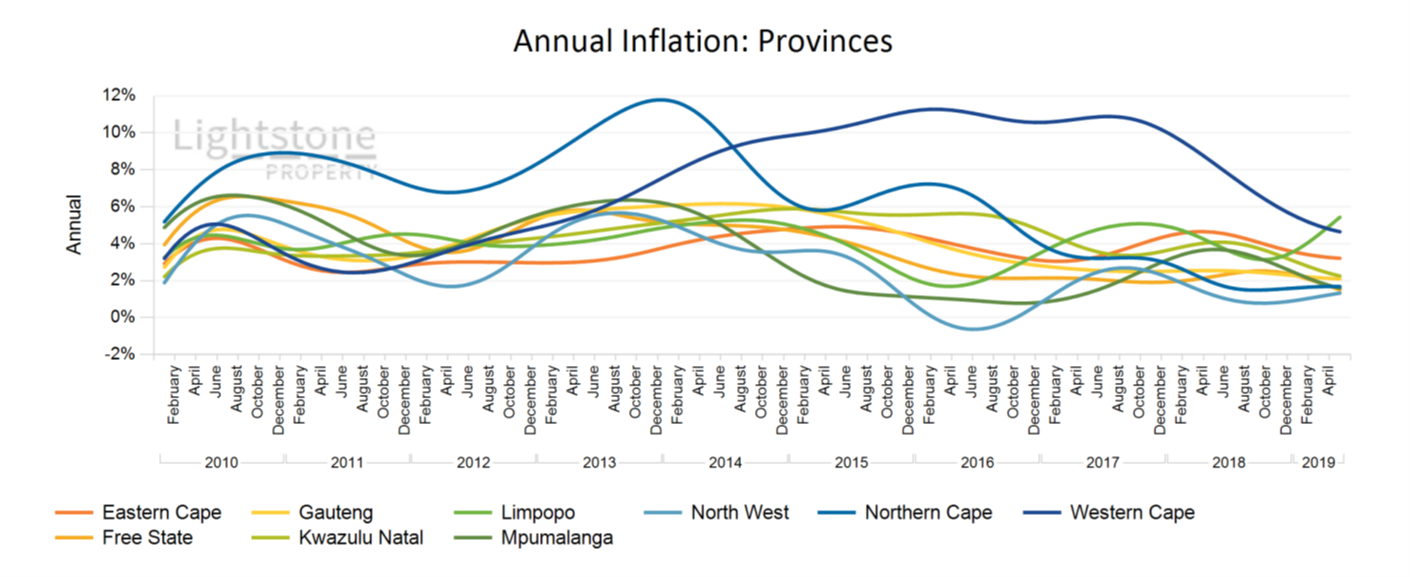
November 2019 National house price inflation index is currently at 2.9%. After a long streak of unrivalled outlying performance, the recent slowdown in the Western Cape has seen it join the ranging market and come second to the optimistic Limpopo province that has just broken out with an annual growth of 5.9%.
 November 2019
Over the past few years the Western Cape’s performance was unrivalled but its slowdown in the last two years has seen it come second to the optimistic Limpopo province that is now growing at 5.9%
 September 2019
As at the end of August 2019 the national house price inflation index was at 3.2%. The market has been ranging in the 2% - 5% zone for some time now following a slowdown in recent months as shown by the provincial indices. Over the past few years the western Cape’s performance was unrivalled but its slowdown in the last two years has seen it come second to the optimistic Limpopo province which is currently growing at 5.4%.
 August 2019
The market has been ranging in the 2% - 5% zone for some time now following a slow down in recent months as shown by the provincial indices. The western Cape has been and still continues to outperform the rest of the provinces with an annual rate of 5.0 % despite a drop of about 3 percentage points in the last 12 months.
 July 2019
The market has been ranging in the 2% - 5% zone for some time now following a slow down in recent months as shown by the provincial indices. The western Cape has been and still continues to outperform the rest of the provinces with an annual rate of 5.7% despite a drop of over 3 percentage points in the last 12 months.
 June 2019
The market has been ranging in the 2% - 5% zone for some time now following a slow down in recent months as shown by the provincial indices. The western Cape has been and still continues to outperform the rest of the provinces with an annual rate of 5.4% despite a drop of over 3 percentage points in the last 12 months.
 May 2019
The market has been ranging in the 2% - 5% zone for some time now following a slow down in recent months as shown by the provincial indices. The western Cape has been and still continues to outperform the rest of the provinces with an annual rate of 5.7% despite a drop of over 3 percentage points in the last 12 months.
 April 2019
The market has been ranging in the 2% - 5% zone for some time now following a slow down in recent months as shown by the provincial indices but this is slowly changing as more provinces start to break above this range, namely Mpumalanga, Limpopo and the Northern Cape province. The western Cape has been and still continues to outperform the rest of the provinces with an annual rate of 5.8% despite a drop of over 3 percentage points in the last 12 months.
 March 2019
The market has been ranging in the 2% - 5% zone for some time now following a slow down in recent months as shown by the provincial indices but this is slowly changing as more provinces start to break above this range, namely Mpumalanga, Limpopo and the Northern Cape province.
 February 2019
The market has been ranging in the 2% - 5% zone for some time now following a slow down in recent months as shown by the provincial indices but this is slowly changing as more provinces start to break above this range, namely Mpumalanga, Limpopo and the Northern Cape province.
 January 2019
The market has been ranging in the 2% - 5% zone for some time now following a slow down in recent months as shown by the provincial indices but this is slowly changing as more provinces start to break above this range, namely Mpumalanga, Limpopo and the Northern Cape province.
 November 2018
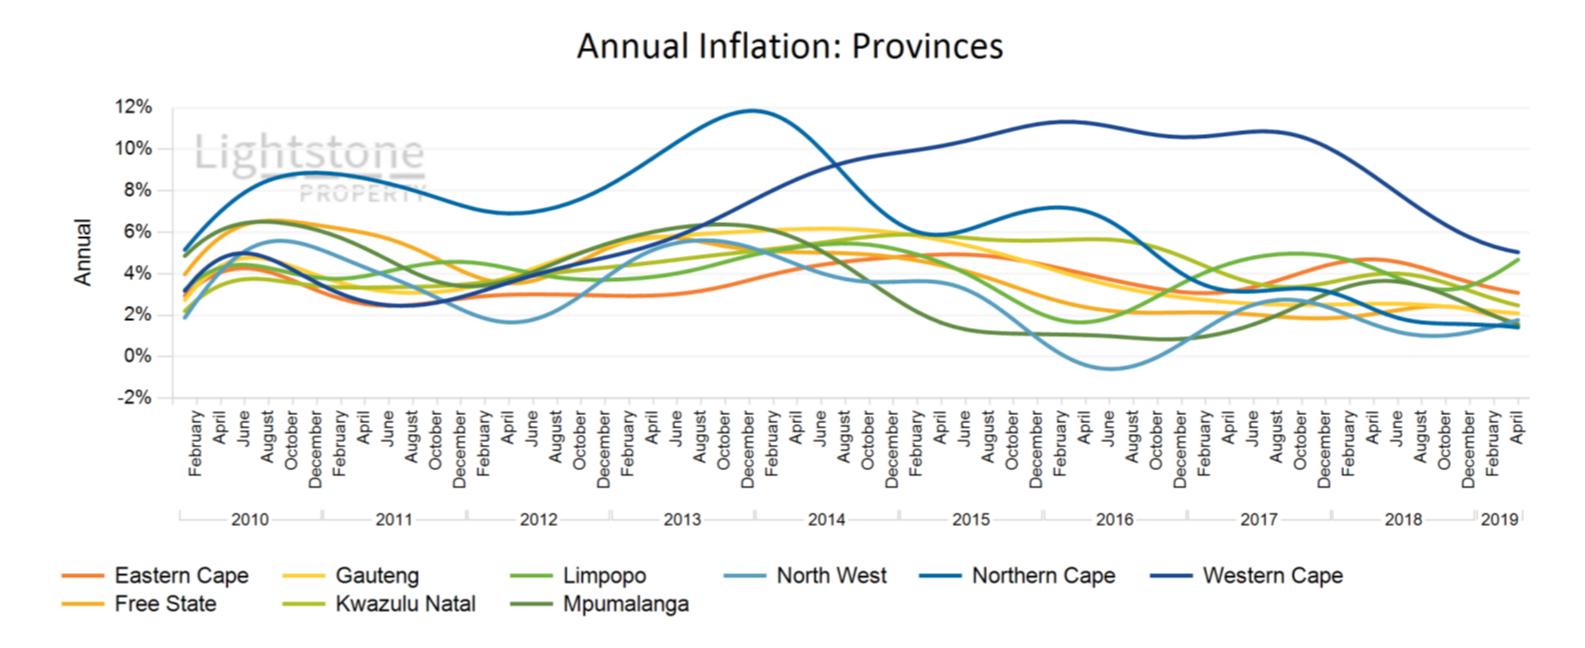
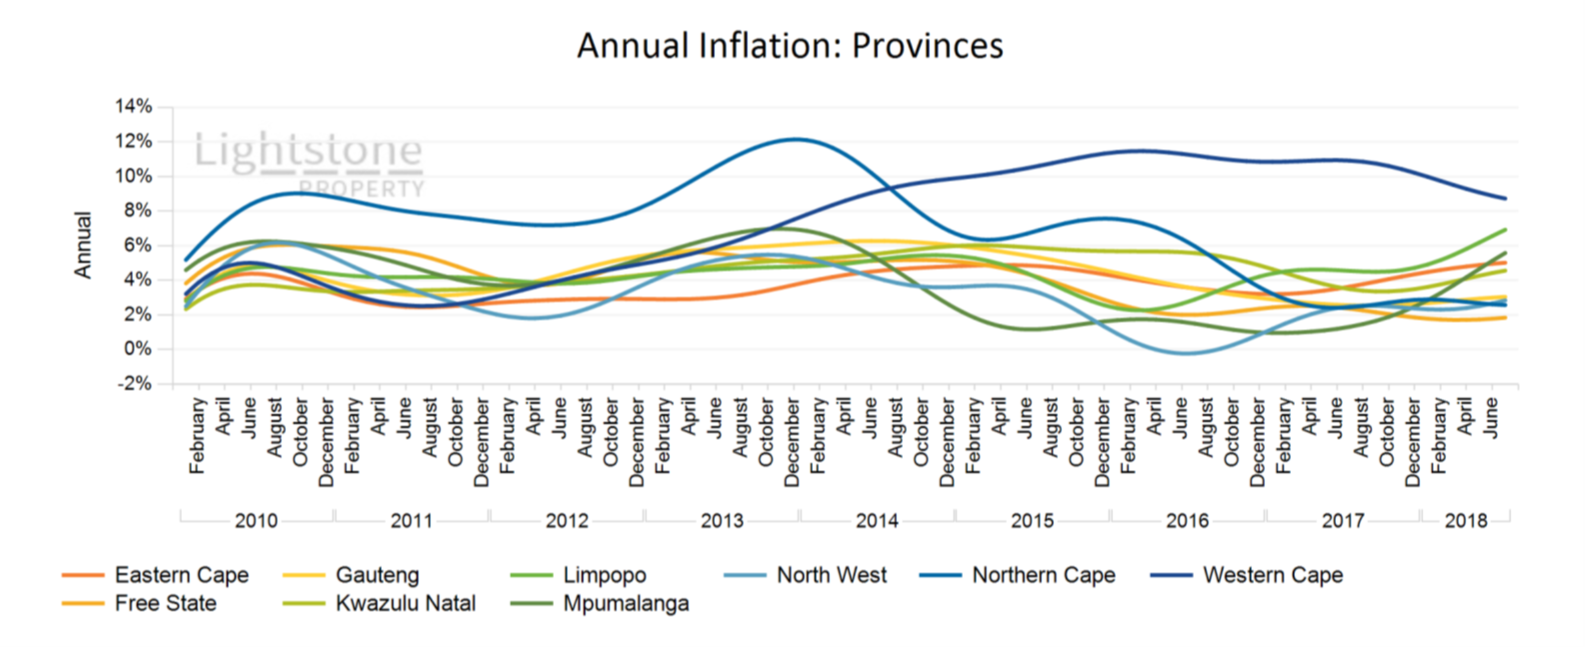
The market has been ranging in the 2% - 5% zone for some time now following a slow down in recent months as shown by the provincial indices but this is slowly changing as more provinces start to break above this range, namely Mpumalanga and Limpopo province. The Western Cape continues to grow at an unmatched annual rate of 8.7%.
 October 2018
The market is currently ranging in the 2% - 5% zone following a slow down in recent months as shown by the provincial indices. This is true for most of our provinces except the Western Cape and Northern Cape; the Western Cape is currently growing at an unmatched annual rate of 9.0% and Northern Cape is on the other extreme end with a growth rate of 2.0% per annum.
 September 2018
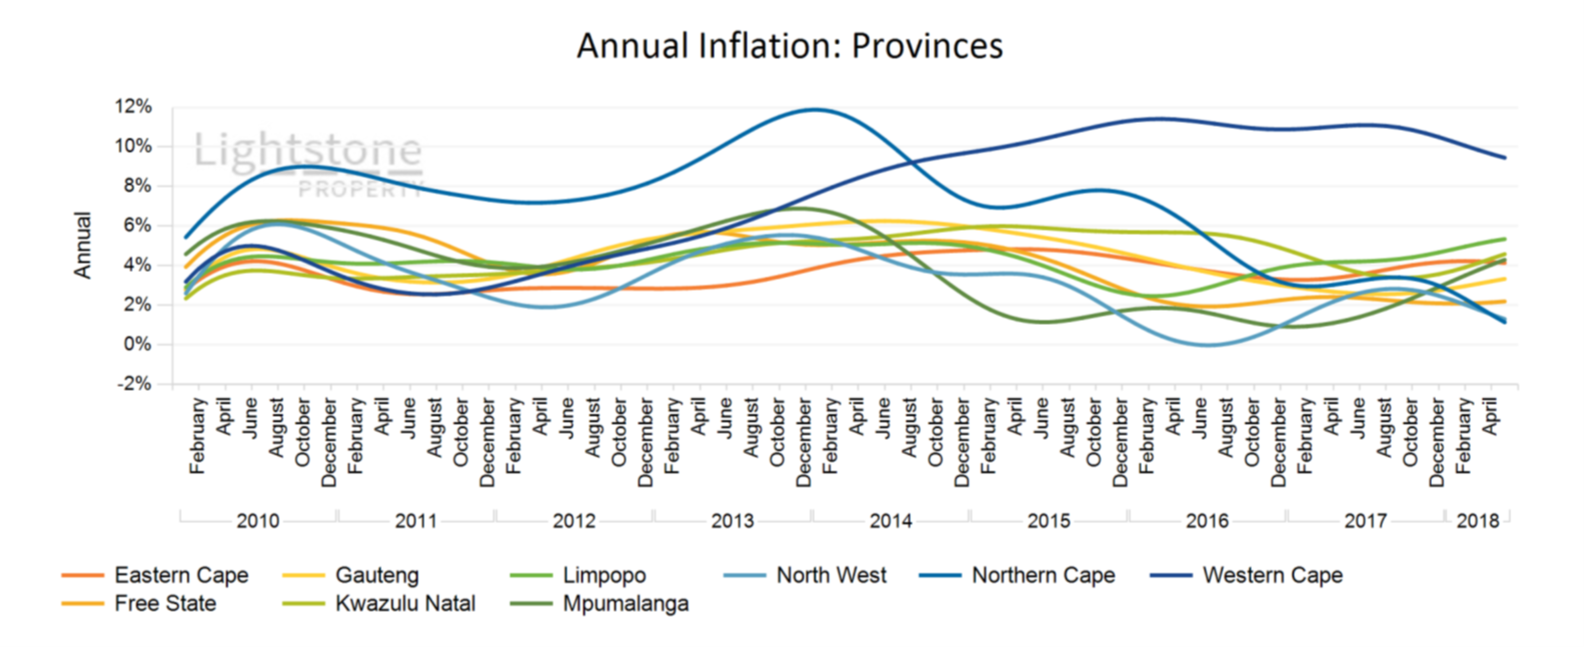
The market is currently ranging in the 2% - 5% zone following a slow down in recent months as shown by the provincial indices. This is true for most of our provinces except the Western Cape and Northern Cape; the Western Cape is currently growing at an unmatched annual rate of 9.5% and Northern Cape is on the other extreme end with a growth rate of 1.1% per annum.
 August 2018
The market is currently ranging in the 2% - 5% zone following a slow down in recent months as shown by the provincial indices. This is true for most of our provinces except the Western Cape and Northern Cape; the Western Cape is currently growing at an unmatched annual rate of 9.9% and Northern Cape is on the other extreme end with a growth rate of 1.1% per annum.
 July 2018
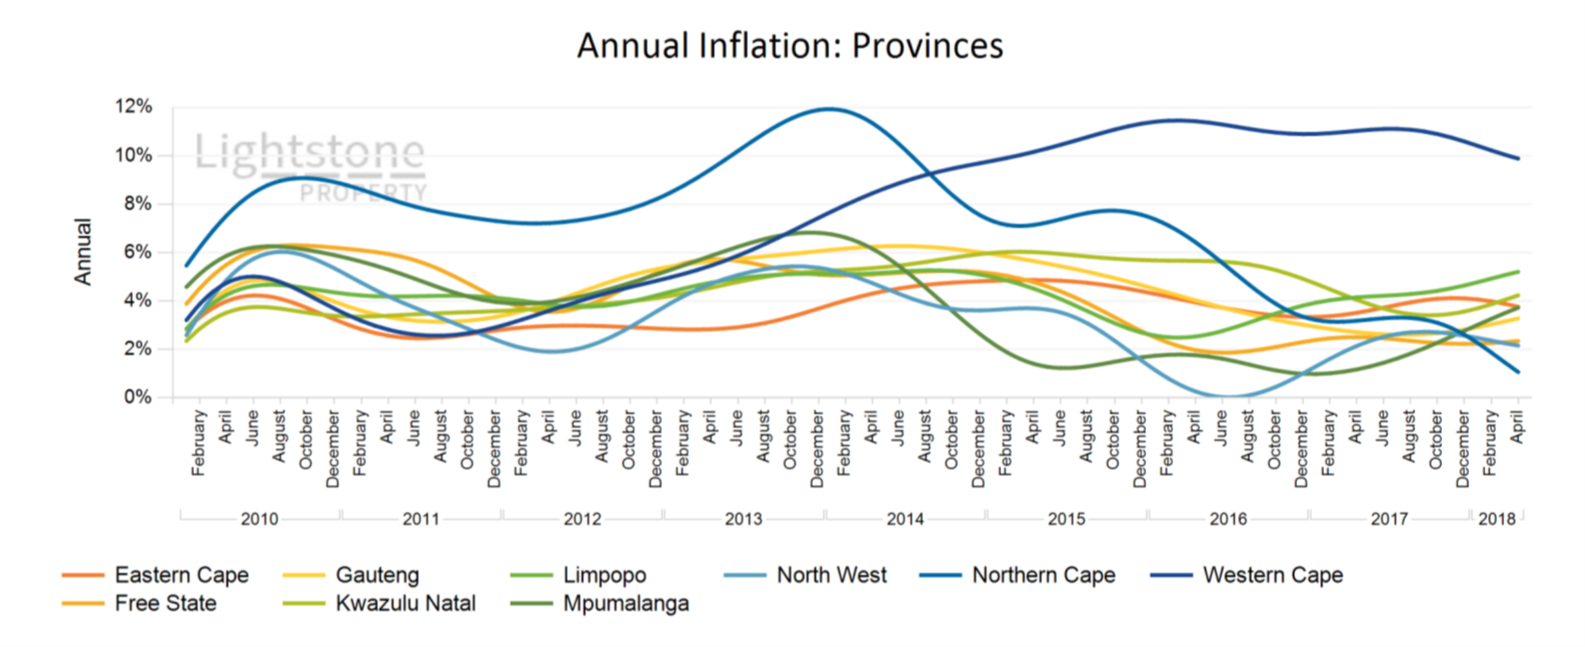
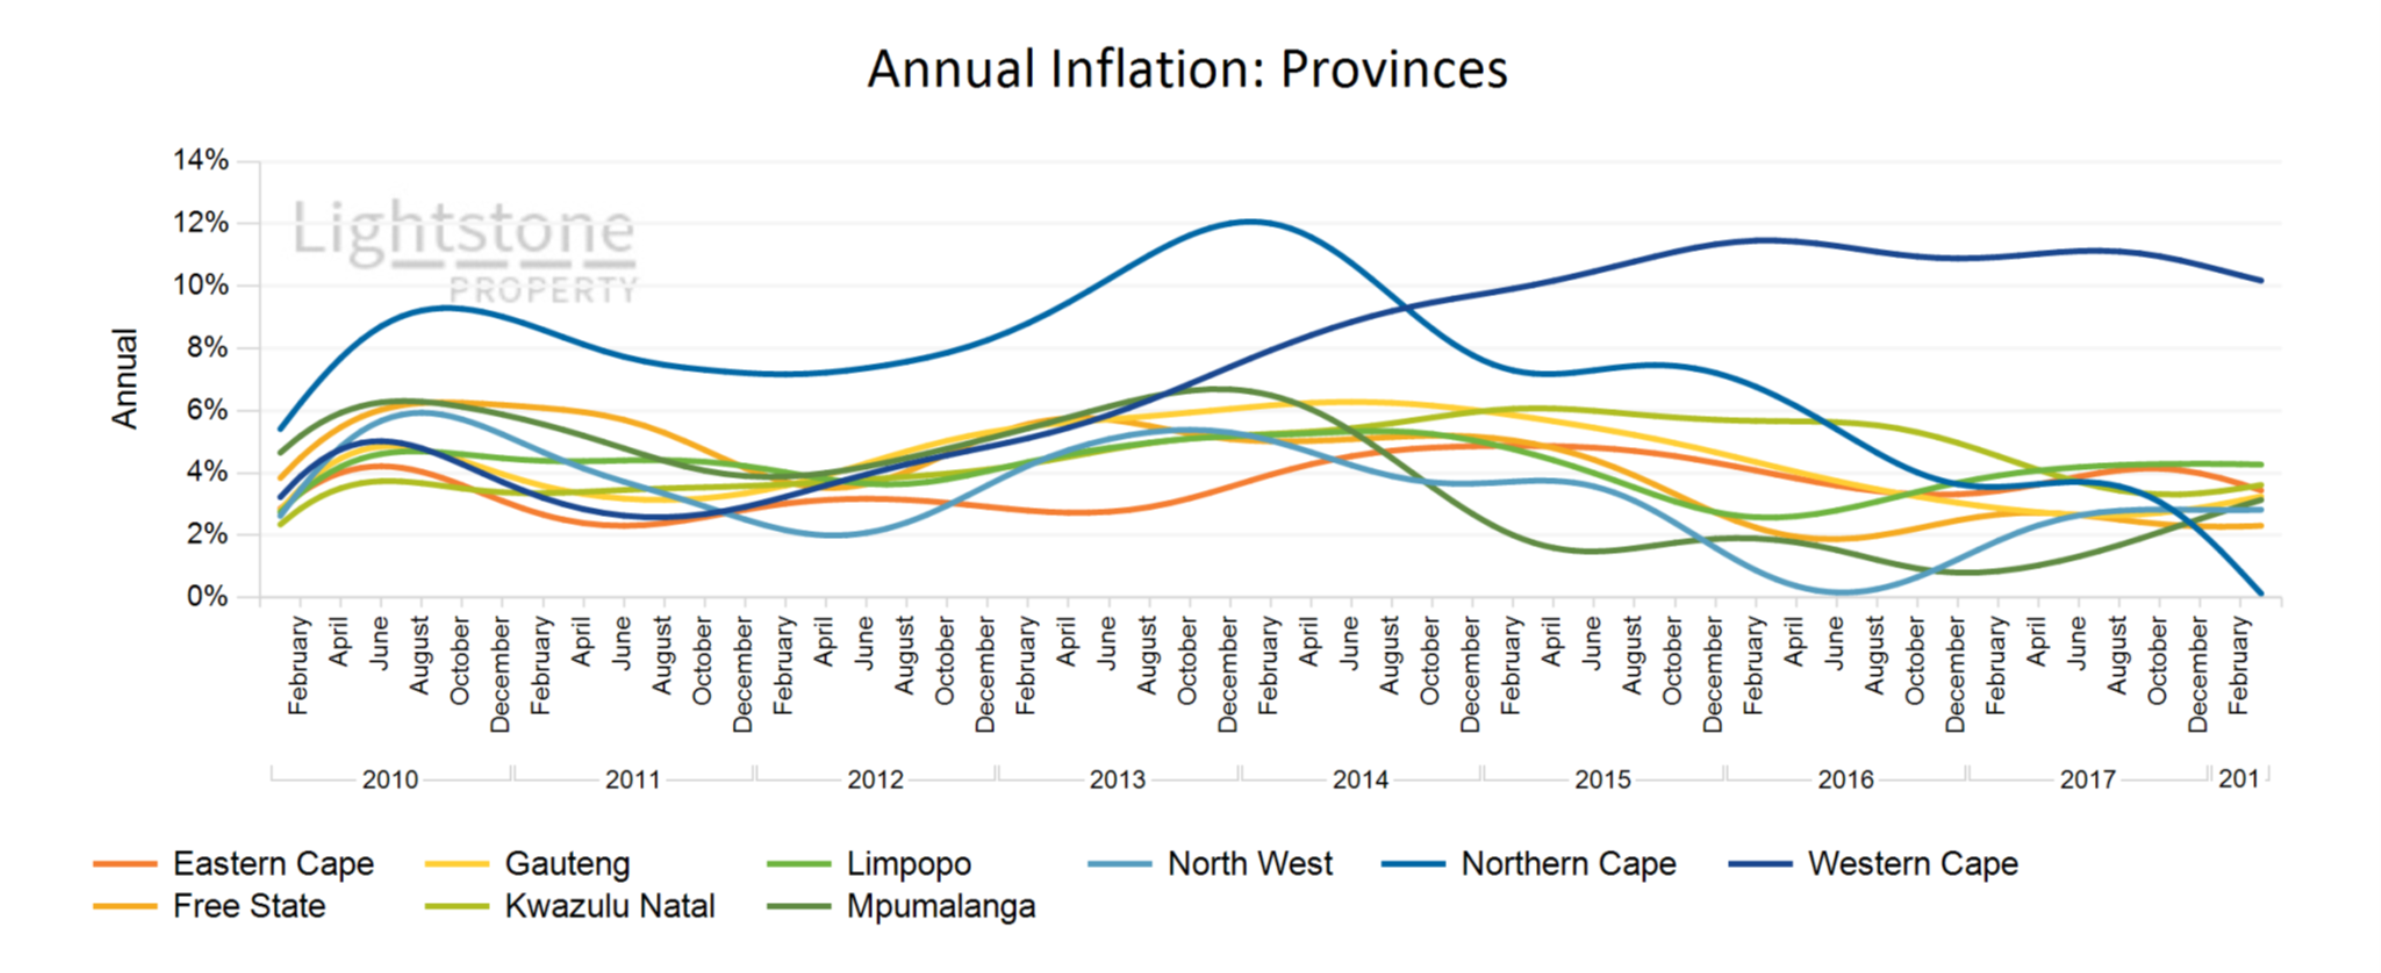
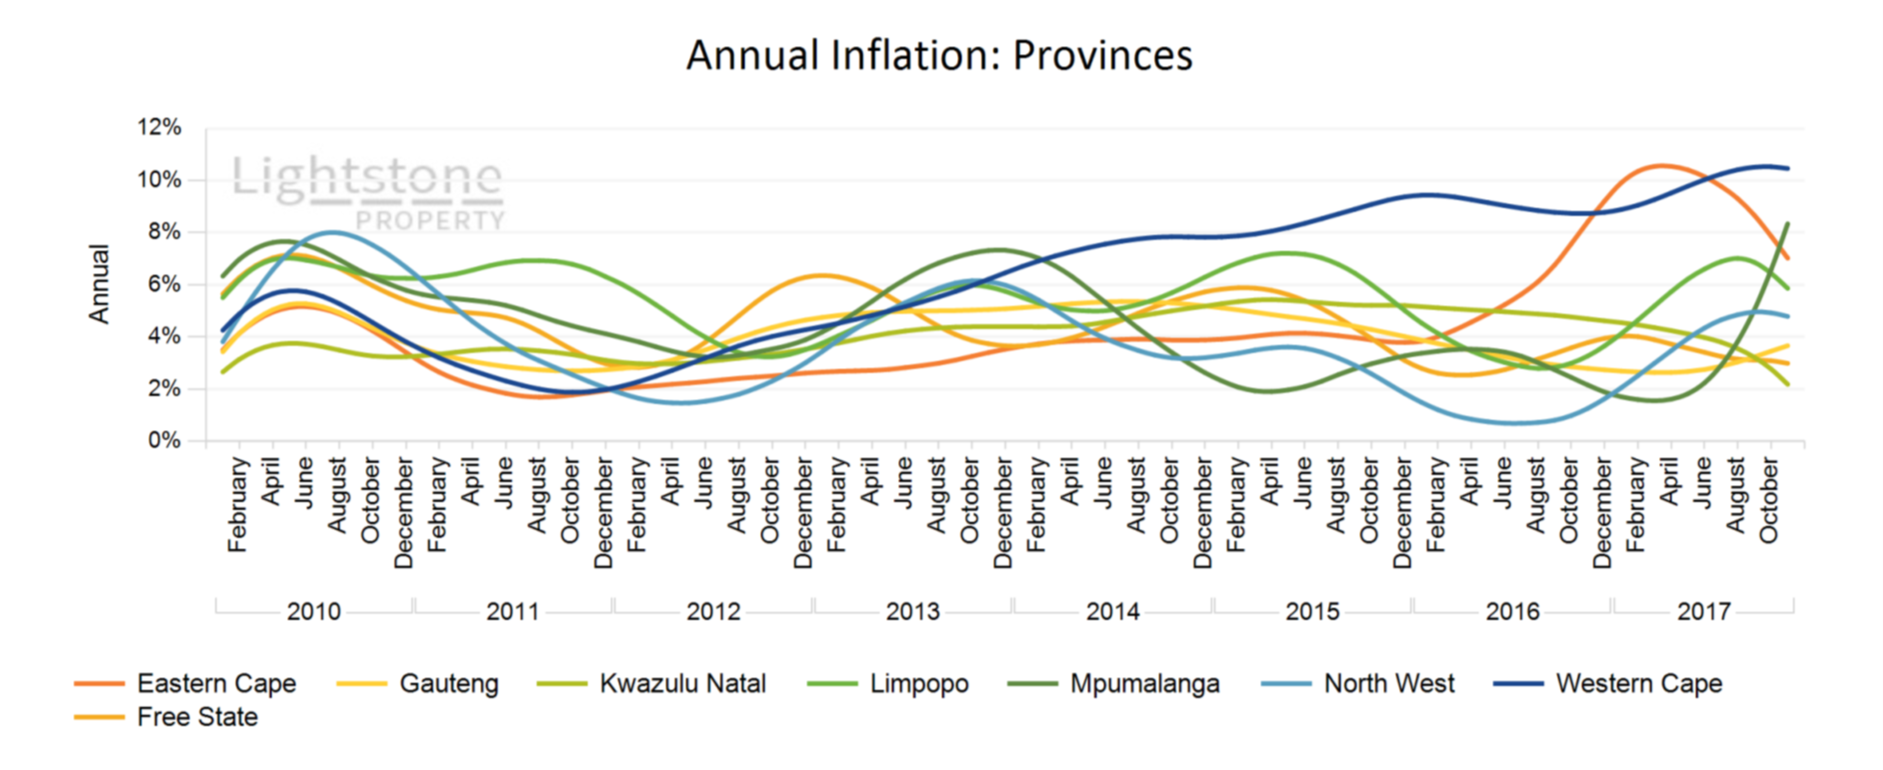
 The market is currently ranging in the 2% - 5% zone following a slow down in recent months as shown by the provincial indices. This is true for most of our provinces except the Western Cape and Northern Cape; the Western Cape is currently growing at an unmatched annual rate of 10.2% and Northern Cape is on the other extreme end with a growth rate of 0.1% per annum.
 June 2018
As at the end of May 2018 the national house price inflation index was at 4.0 %. The market is currently ranging in the 2% - 5% zone following a slow down in recent months as shown by the provincial indices. This is true for most of our provinces except the Western Cape and Northern Cape; the Western Cape is currently growing at an unmatched annual rate of 10.6% and Northern Cape is on the other extreme end with a growth rate of 1.1% per annum.
 May 2018
As at the end of April 2018 the national house price inflation index was at 3.9 %. The market has since broken above the 2%-5% range following a consolidation in that zone as shown by the provincial indices. This is true for most of our indices except for coastal provinces in the east namely the Eastern Cape and KwaZulu-Natal as well as the Western Cape; these are slowing down with KwaZulu-Natal being the only one to break below the zone.
 April 2018
As at the end of March 2018 the national house price inflation index was at 4.0 %. Over the past couple of months the market activity has stabilized in the 2%-5% range following a slowdown in recent months as shown by the provincial indices. This is true for most of our indices except the Western Cape which is currently growing at an unmatched 9.3%, and the optimistic Limpopo and Mpumalanga province breaking above this range.
 March 2018
As at the end of February 2018 the national house price inflation index was at 4.1 %. Over the past couple of months the market activity has stabilized in the 3%-8% range following a slowdown in recent months as shown by the provincial indices. This is true for most of our indices except the Western Cape which is currently growing at an unmatched 10.5%, and the optimistic Mpumalanga breaking above this range.
 March 2018
As at the end of January 2018 the national house price inflation index was at 4.2 %. Over the past couple of months the market activity has stabilized in the 3%-8% range following a slowdown in recent months as shown by the provincial indices. This is true for most of our indices except the Western Cape which is currently growing at an unmatched 10.8%. The inland municipalities Ekurhuleni, City of Tshwane and City of Johannesburg metros are growing stably at rates between 2% and 5% whereas the coastal municipalities are generally performing above this range.
 January 2018
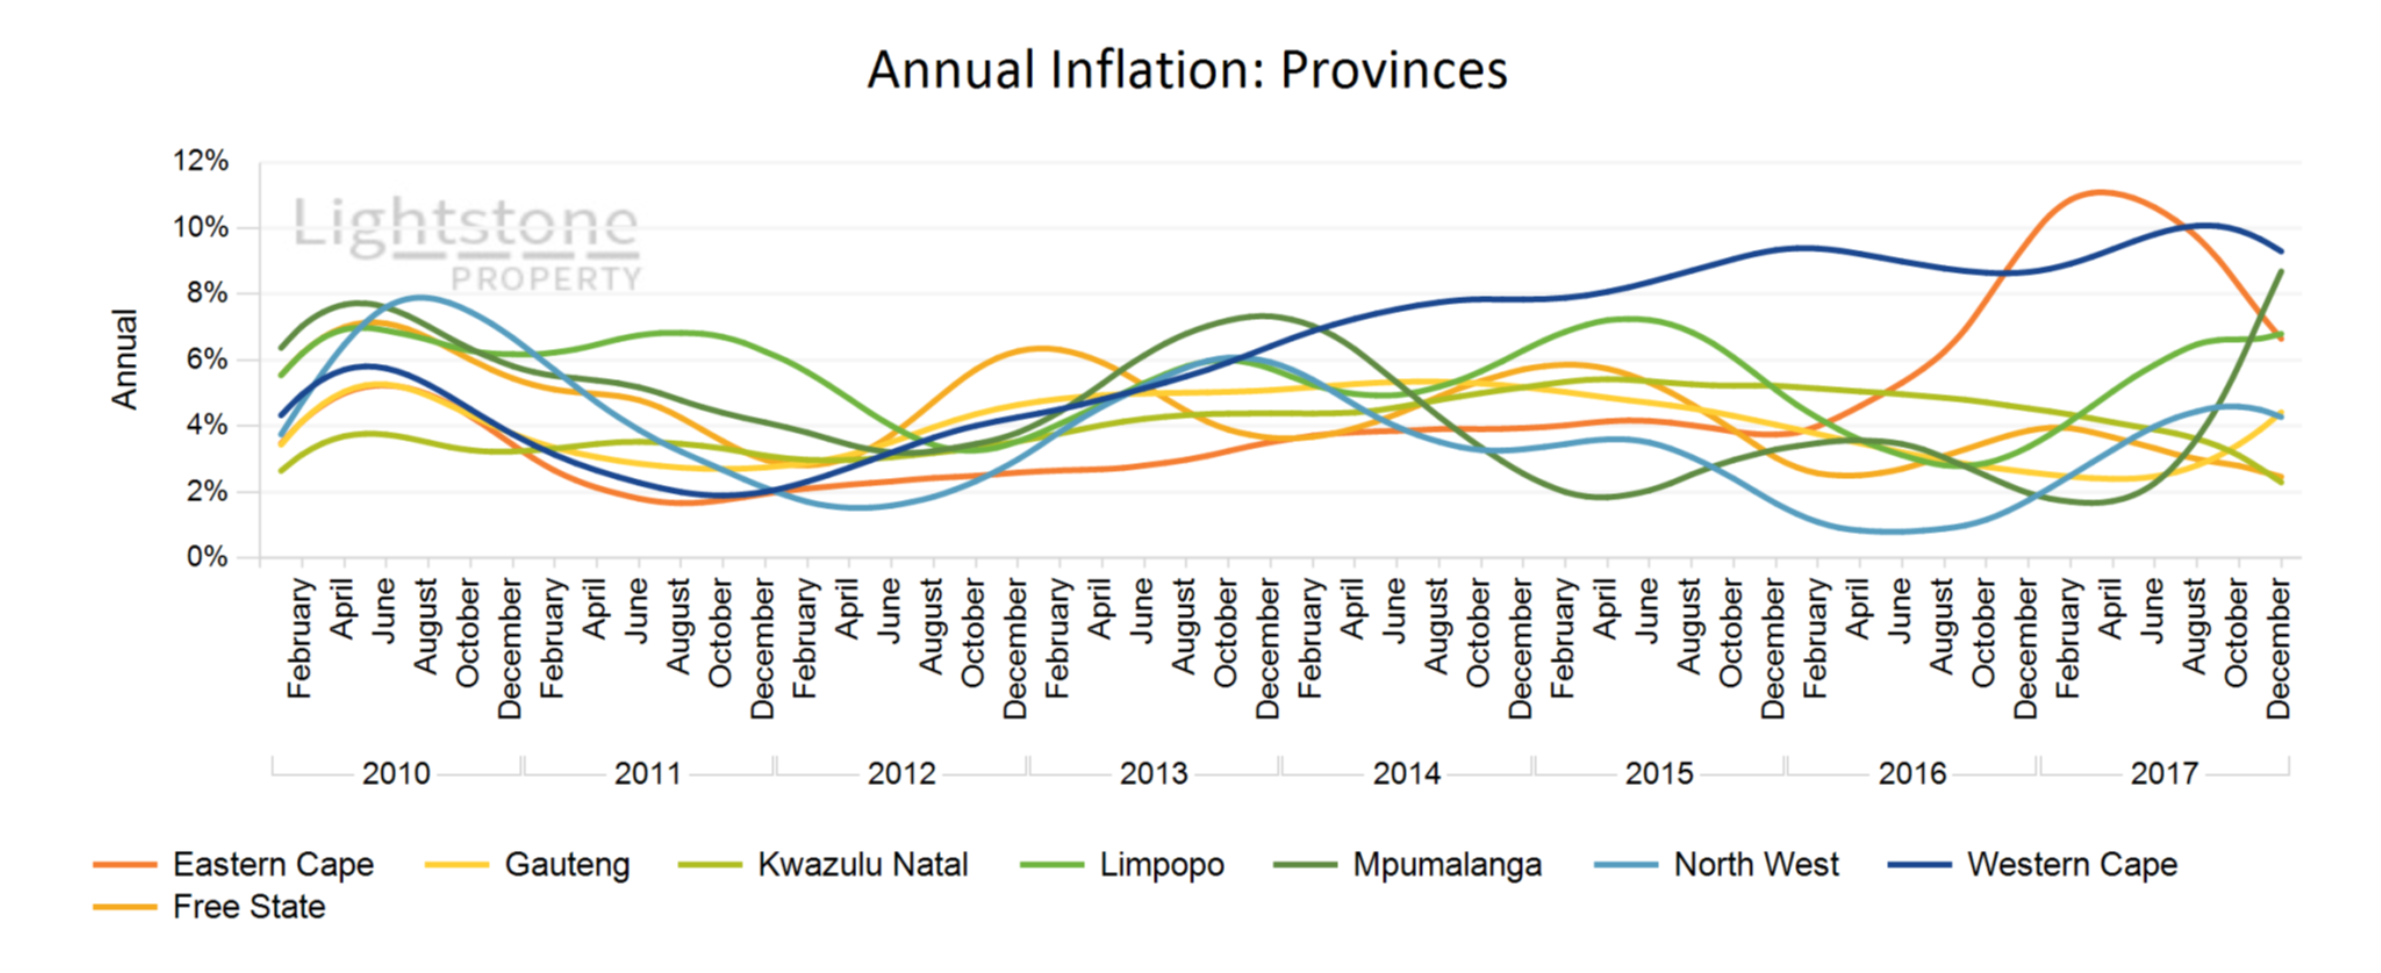
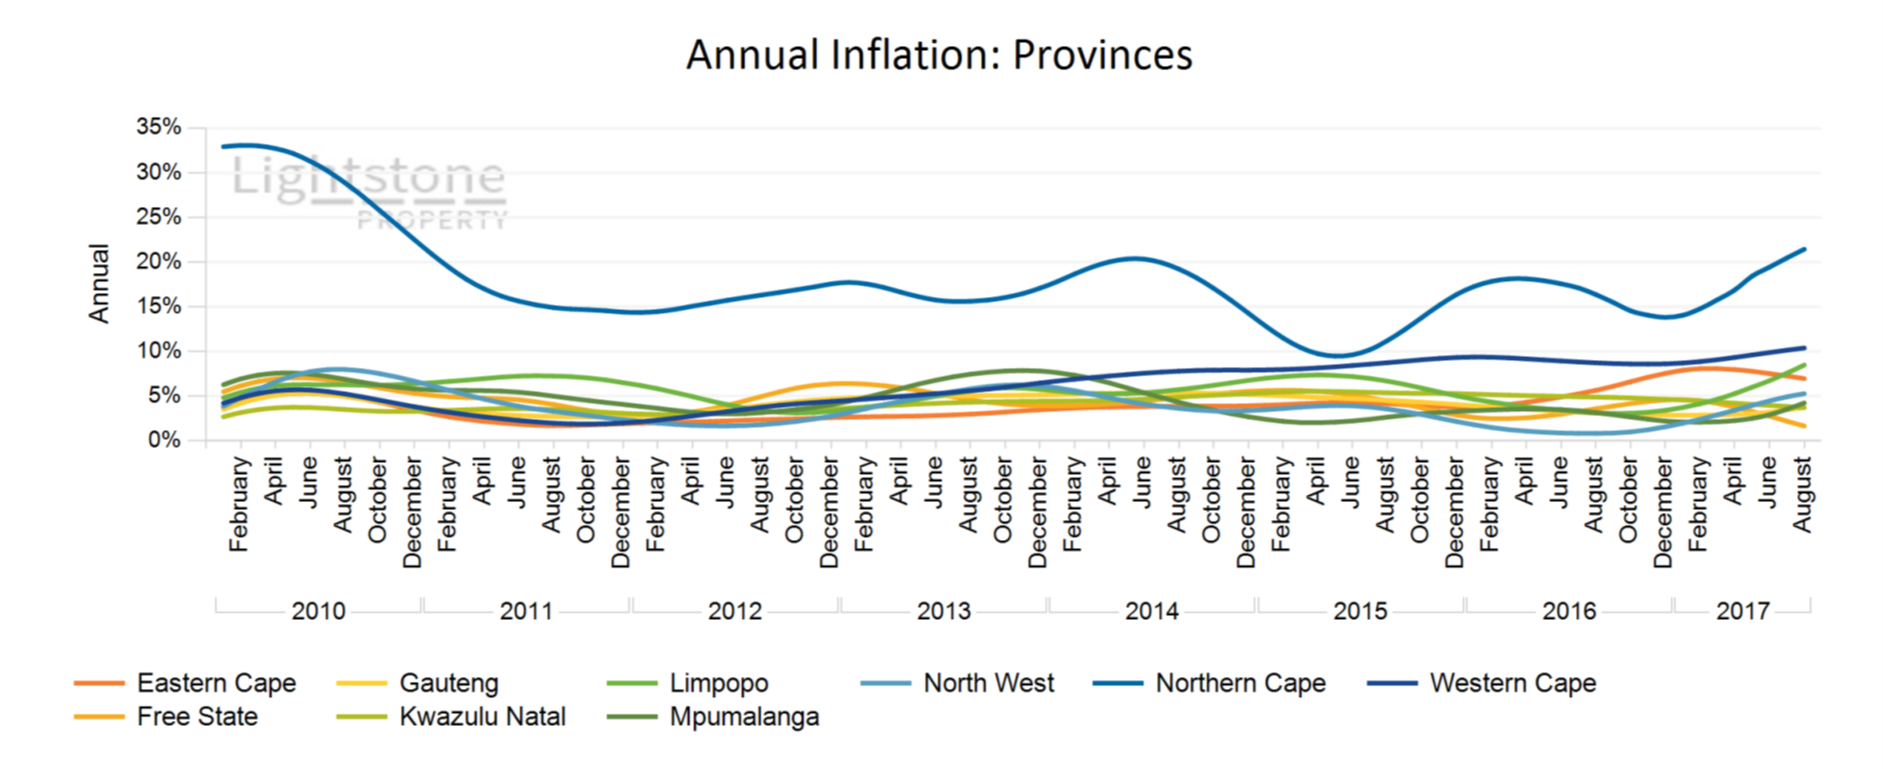
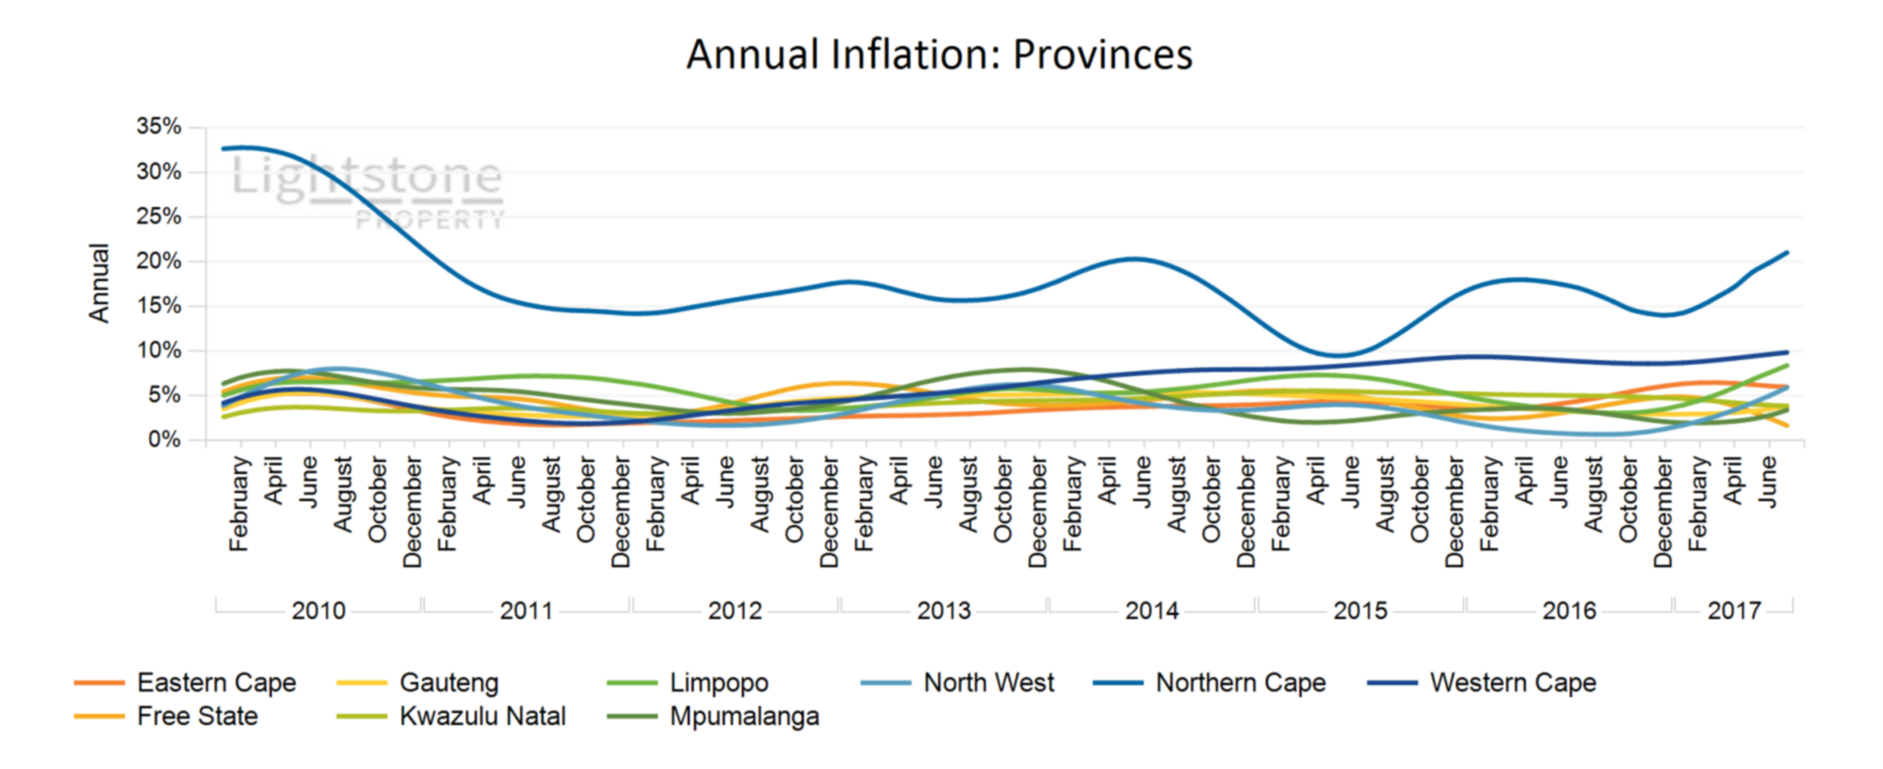
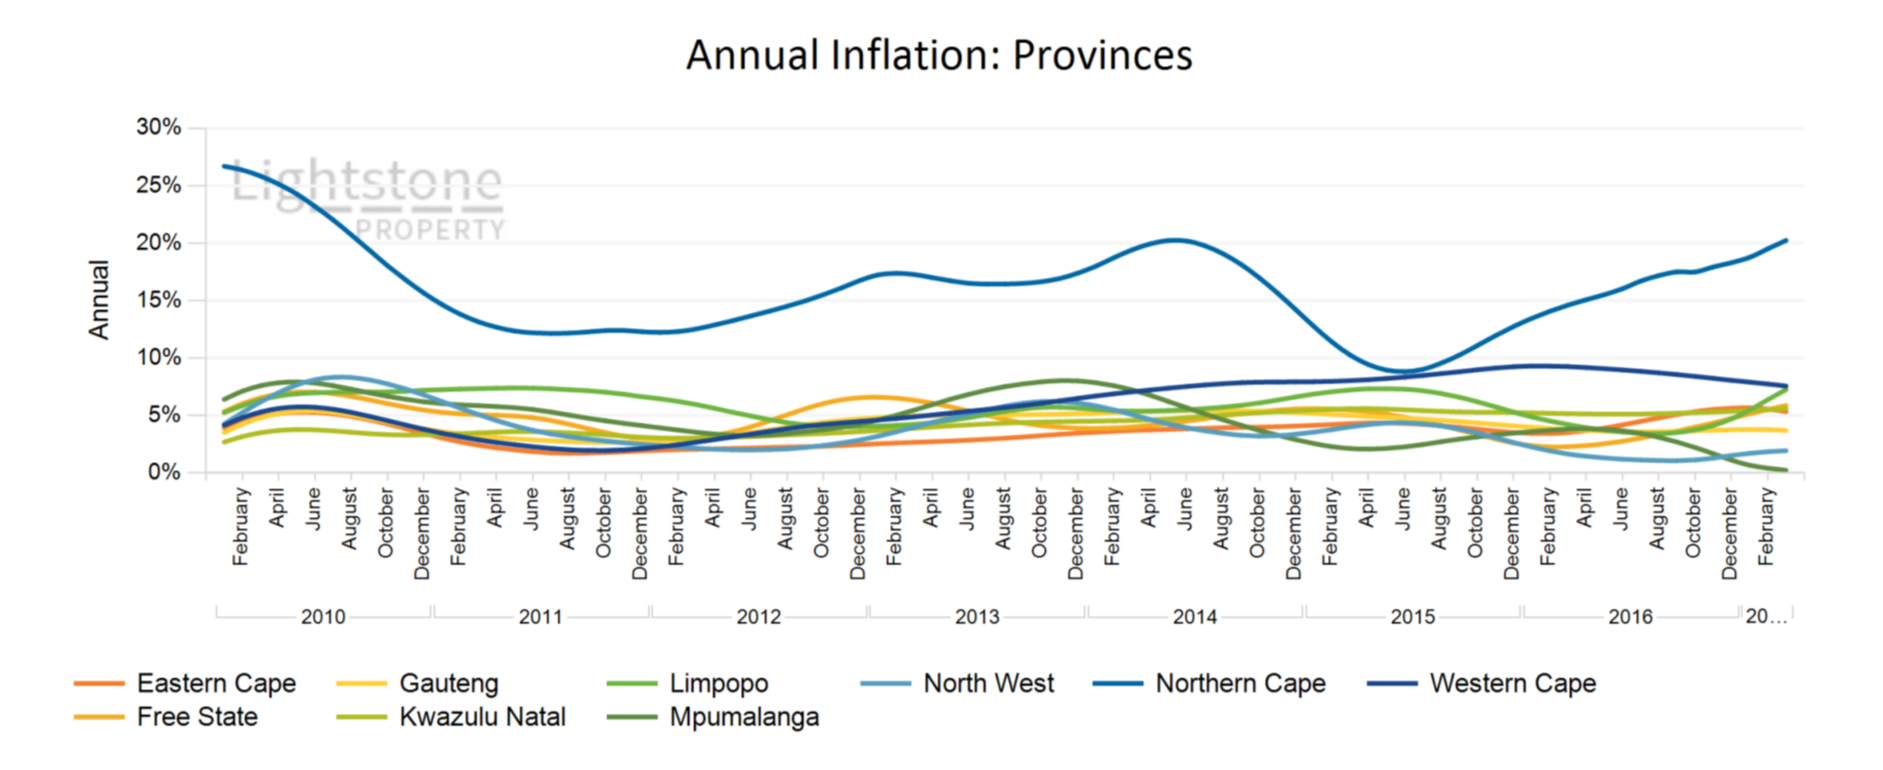
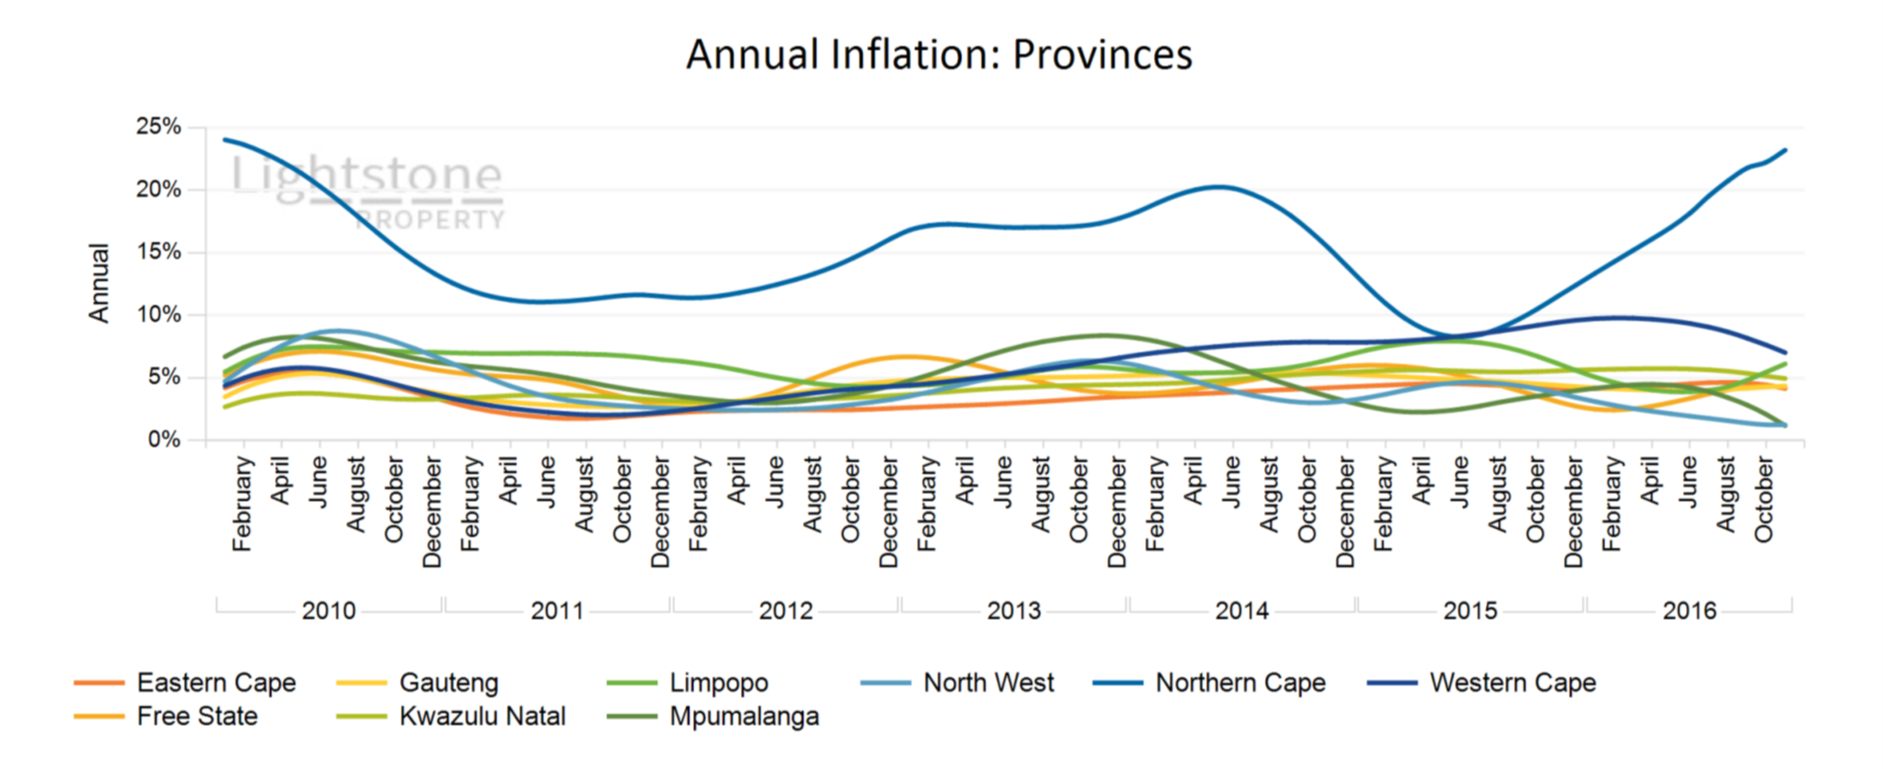
As at the end of December 2017 the national house price inflation index was at 4.1 %. Over the past couple of months the majority of market activity has stabilized in the 3%-8% range following a slowdown in recent months as shown by the provincial indices. This is true for most of our indices except for the two top-tiers, the Western Cape and Northern Cape province, which are currently growing at 11.0% and 20.7% respectively.
 December 2017
As at the end of November 2017 the national house price inflation index was at 4.0 %. Over the past couple of months the majority of market activity has stabilized in the 3%-8% range following a slowdown in recent months as shown by the provincial indices.
 November 2017
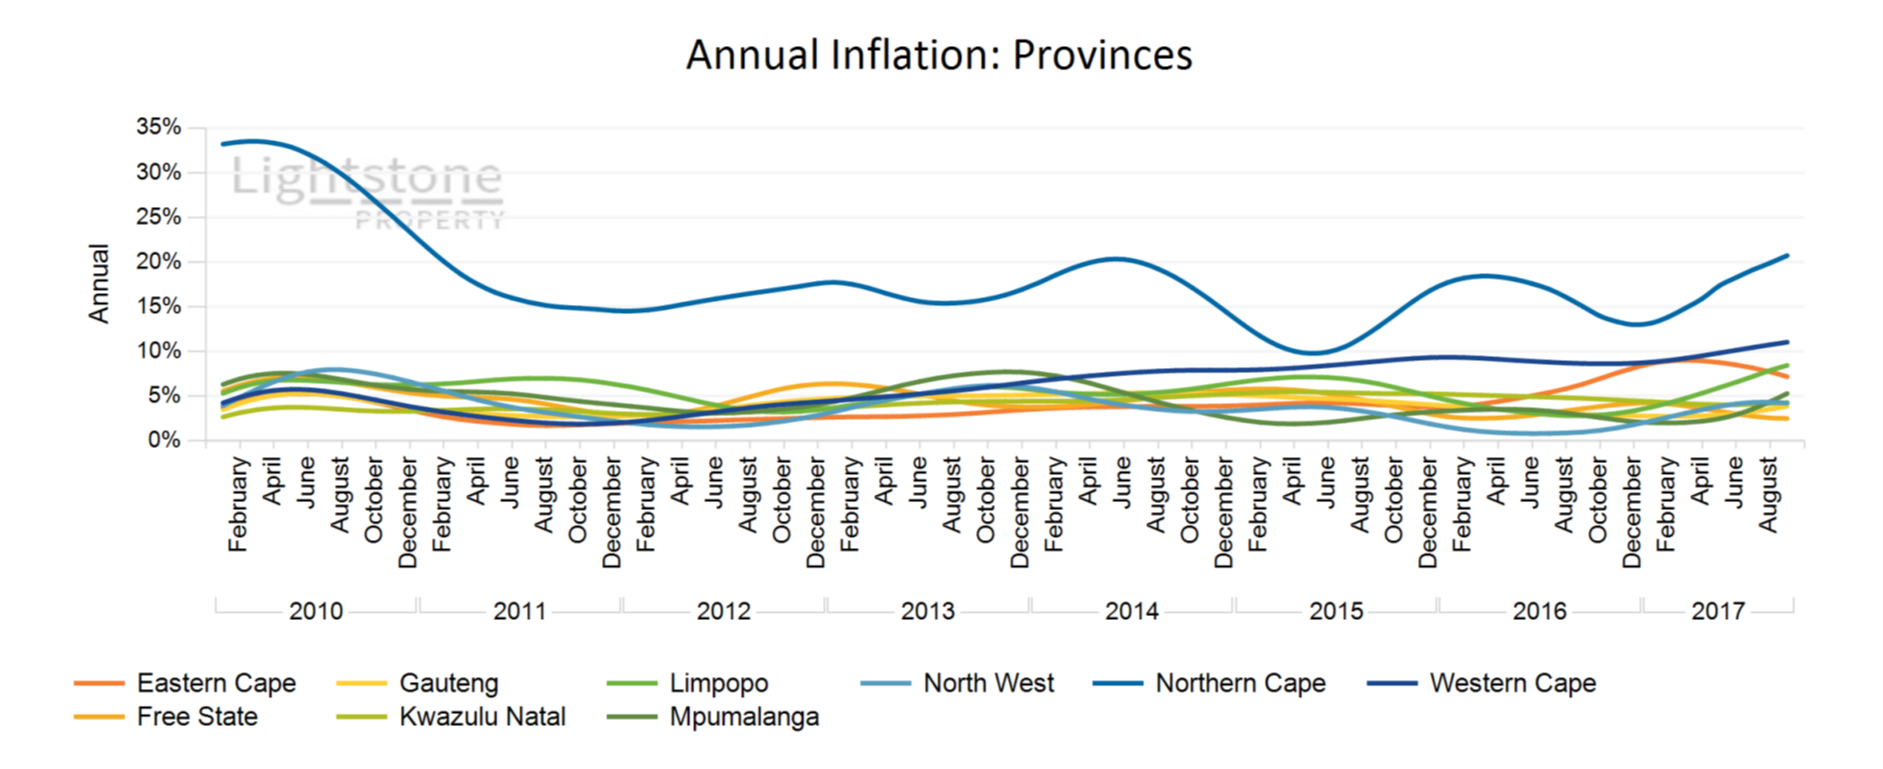
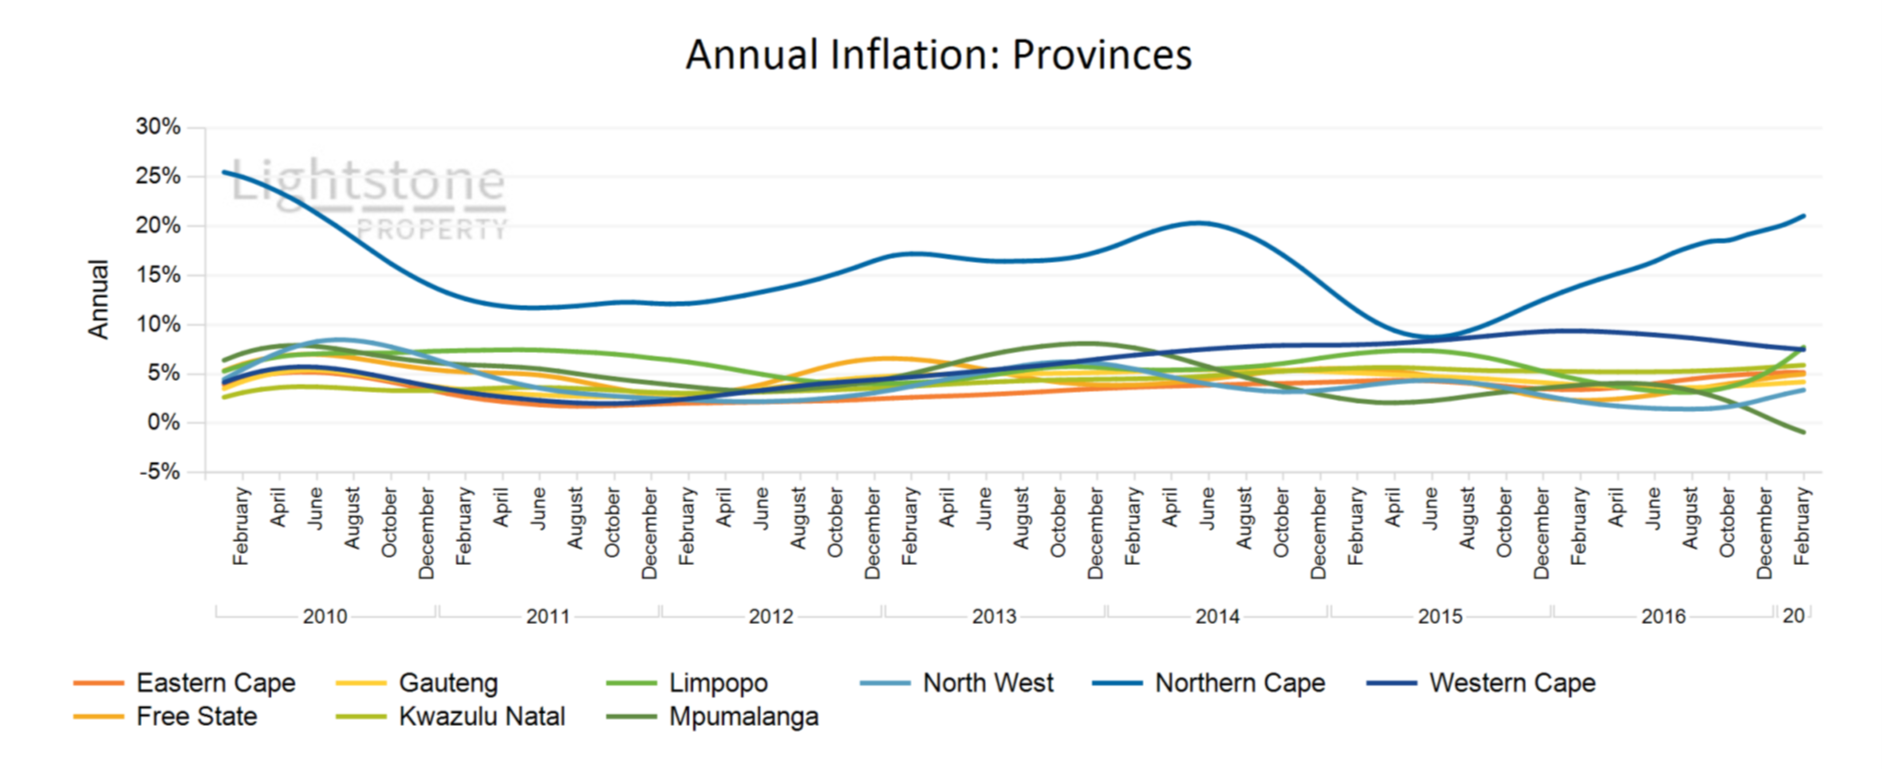
As at the end of October 2017 the national house price inflation index was at 3.7 %. Over the past couple of months the majority of market activity has stabilized in the 2%-7% range following a slowdown in recent months as shown by the provincial indices. This is true for most of our indices except for the Free-State and our two top-tiers, the Western Cape and North-West province; the Free-State is still slowing down and lagging with a 1.7% inflation rate whilst the top-tiers are currently growing at 9.8% and 21.0% for the Western-Cape and North-West province respectively.
 October 2017
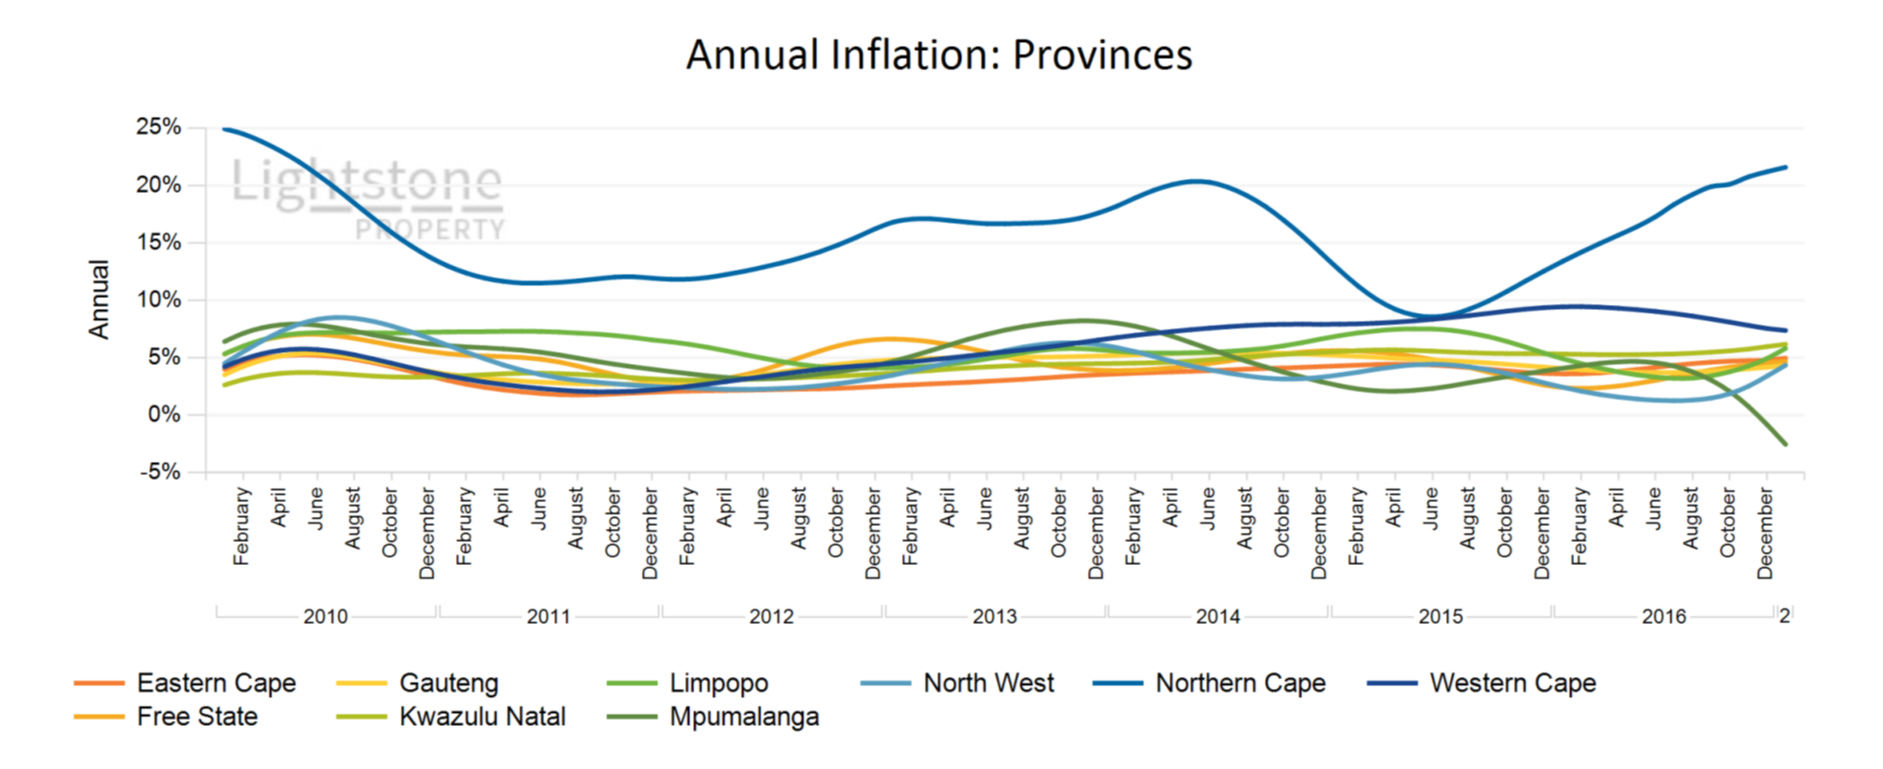
As of late the majority of market activity has stabilized in the 2%-7% range following a slowdown over recent months as shown by the provincial indices. Although this is true for most of our indices, we have on the one hand the North-West and Limpopo province which have recoved and are showing some optimism, and a buoyantly growing Northern Cape index on the other currently growing at 22.0%.
 September 2017
As at the end of August 2017 the national house price inflation index was at 4.1 %. The market has since stabilized in the 3%-7% range following a slowdown over recent months as shown by the provincial indices. Although this is true for most of them, we have on the one hand the North-West province which is still recovering and showing some optimism, and a buoyantly growing Northern Cape index on the other currently at 22.4%.
 August 2017
The market has since stabilized in the 3% - 7% range following a slowdown over recent months as shown by the provincial indices. Although this is true for most of them, we have on the one hand the North-West and Mpumalanga province which are still recovering and showing some optimism, on the other a buoyantly growing Northern Cape index which is currently at 21.7%.
 July 2017
Looking at the overall picture at provincial level the market has evidently stabilized in the 3%-7% range after a slowdown over recent months. The Western Cape, Eastern Cape and Mpumalanga province are still slowing down trailing this category of indices, with the latter dropping near the 0% mark.
 June 2017
Looking at the overall picture at provincial level the market is evidently stabilizing in the 3%-7% range after a slowdown over recent months. The Western Cape and Mpumalanga province are still slowing down trailing this category of indices, with the latter dropping below the 0% mark. Contrary to other provinces the Northern Cape continues its optimistic growth currently at an unrivalled 21.6% per annum. Showing optimism too and good recovery is the Limpopo index which has broken above the stability range.
 May 2017
As at the end of April 2017 the national house price inflation index was at 3.7%. Looking at the overall picture at provincial level the market is evidently stabilizing in the 3%-6% range after a slowdown over recent months. The Western Cape and Mpumalanga province are still slowing down trailing this category of indices, with the latter dropping below the 0% mark. Contrary to other provinces the Northern Cape continues its optimistic growth currently at an unrivalled 21.6% per annum.
 May 2017
As at the end of March 2017 the national house price inflation was at 3.8%. Looking at the overall picture at provincial level the market is evidently stabilizing in the 3%-6% range after a slowdown over recent months.
 March 2017
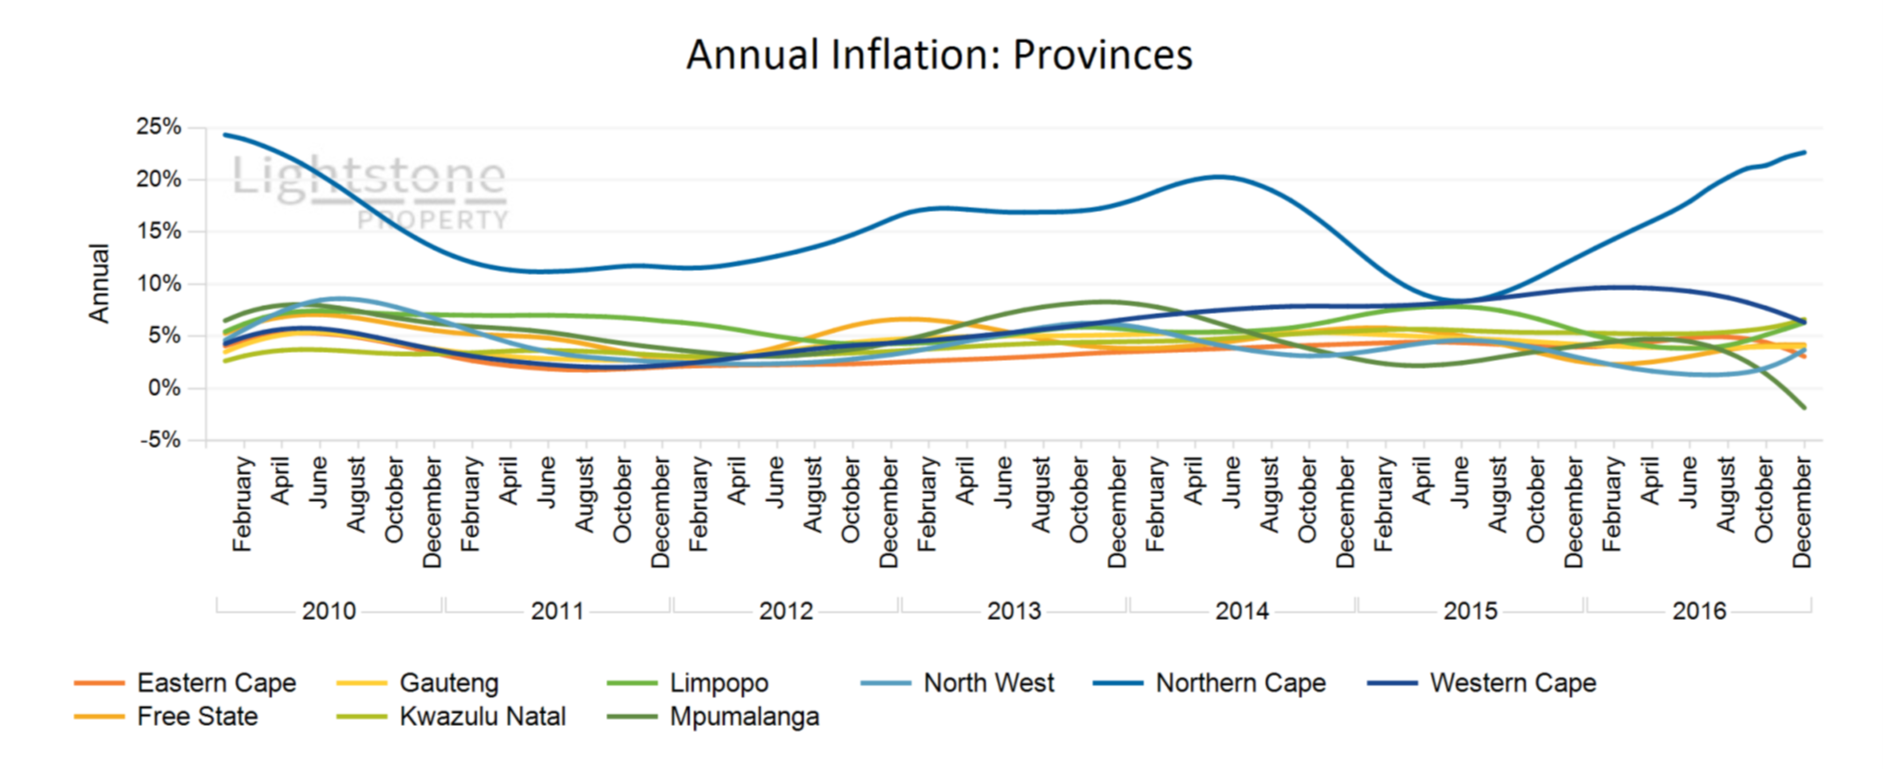
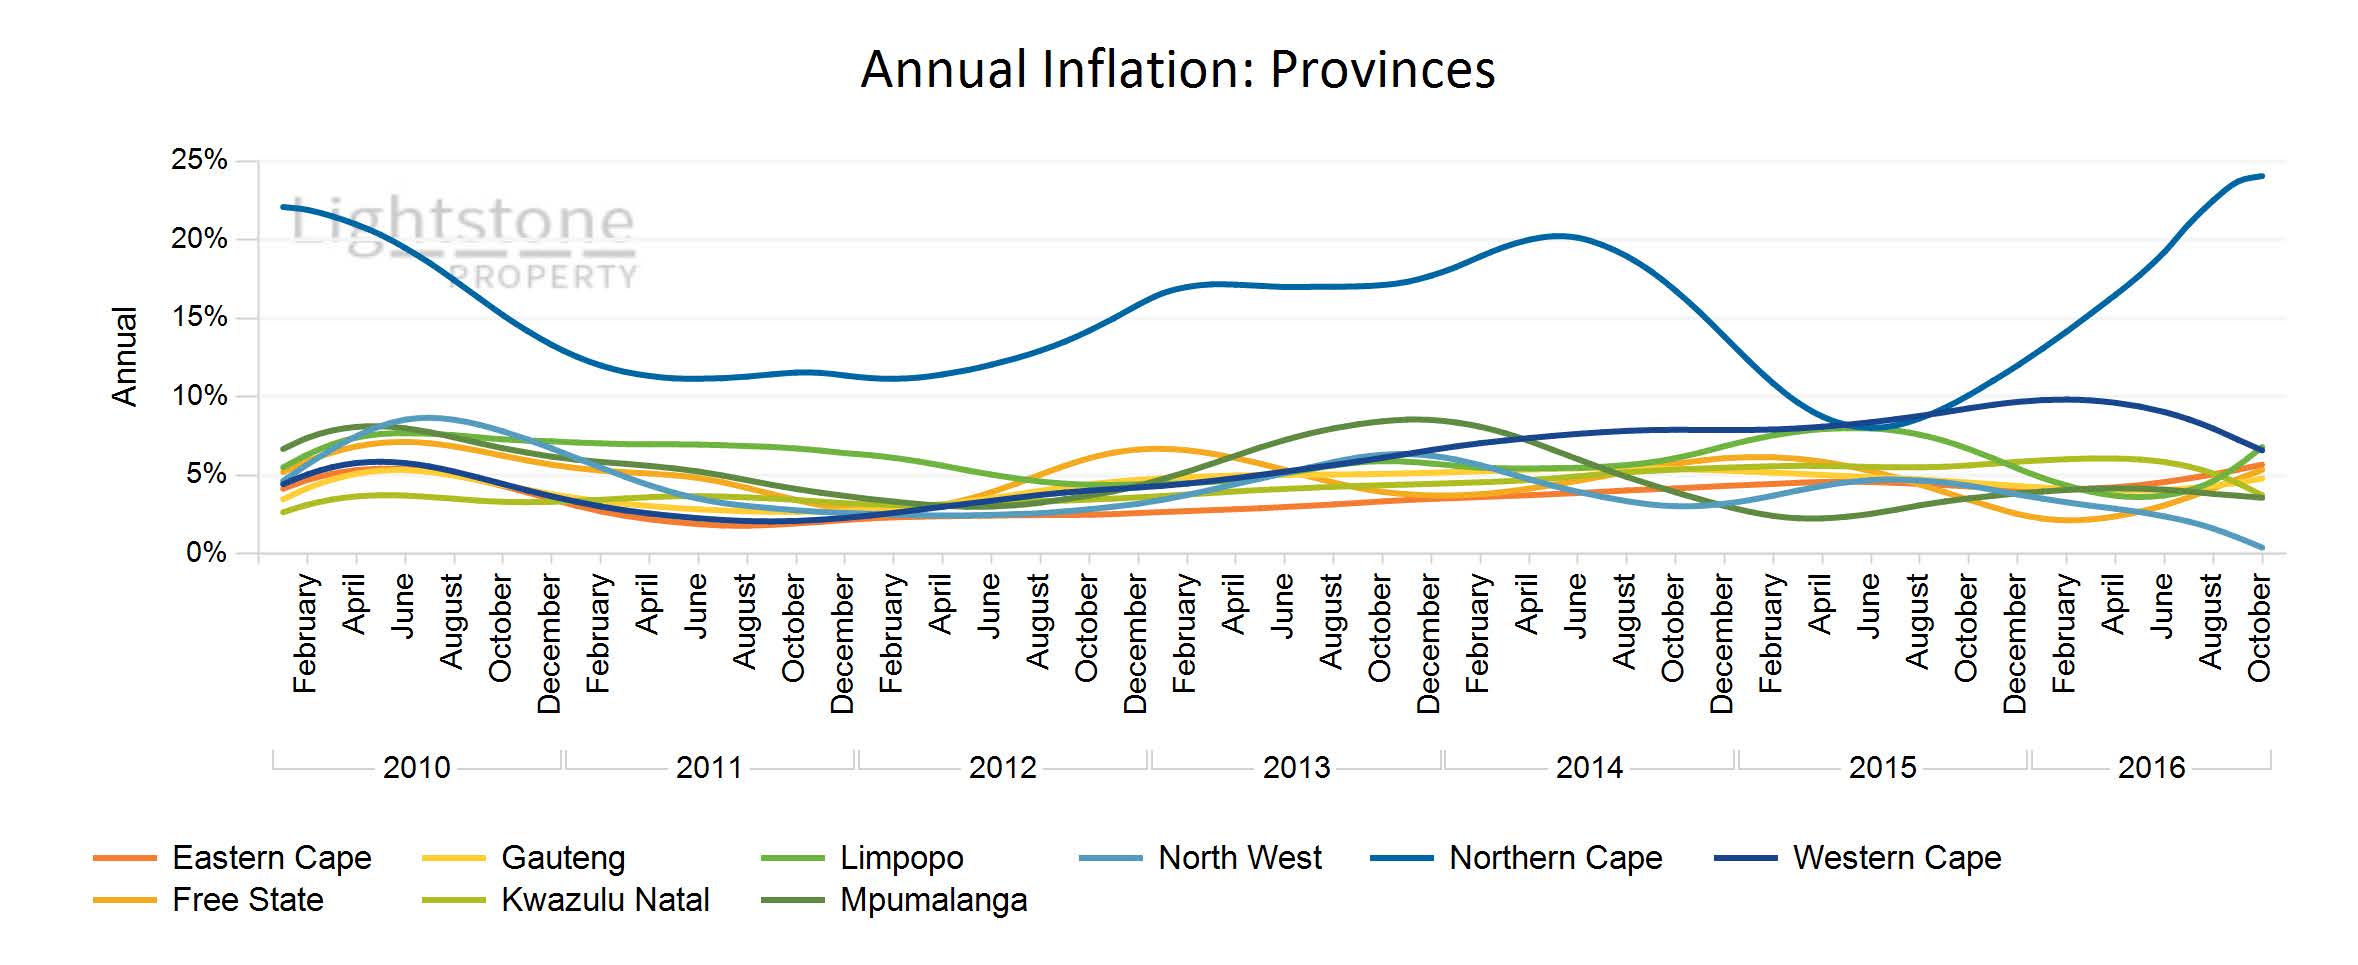
As at the end of February 2017 the national house price inflation was at 3.7%. Looking at the overall picture at provincial level it is evident the market has been slowing down over recent months. The Northern Cape, Free State and Limpopo are exceptions. Their inflation rates have been increasing gradually in 2016 with their latest being highest in the year. The Northern Cape persistently grows at an unrivalled 24.1%.
 February 2017
As at the end of January 2017 the national house price inflation was at 3.5%. Looking at the overall picture at the provincial level it is evident the market has been slowing down over recent months with the exception of Free State and Limpopo. These have shown a gradual ascent in 2016 with their latest inflation rates being highest in the year. The Northern Cape continues growing at an unrivalled 24.1%.
 January 2017
As at the end of December 2016 the national house price inflation was at 3.4%. Looking at the overall picture at provincial level it is evident the market has been slowing down over recent months and this is more pronounced in the Western Cape and the North West provinces.
 December 2016
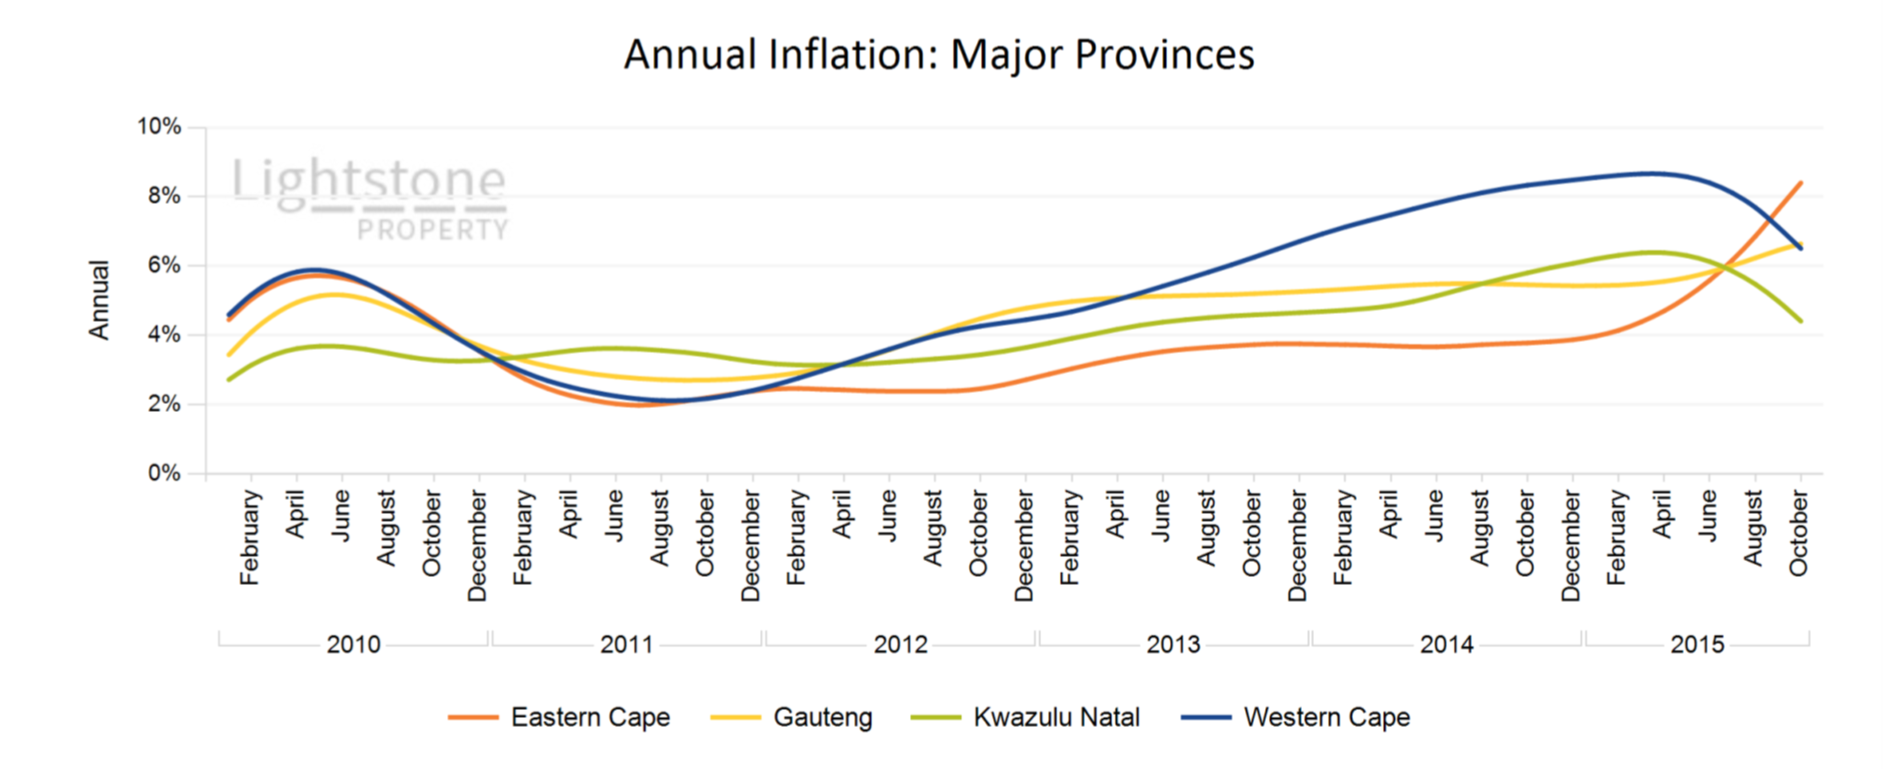
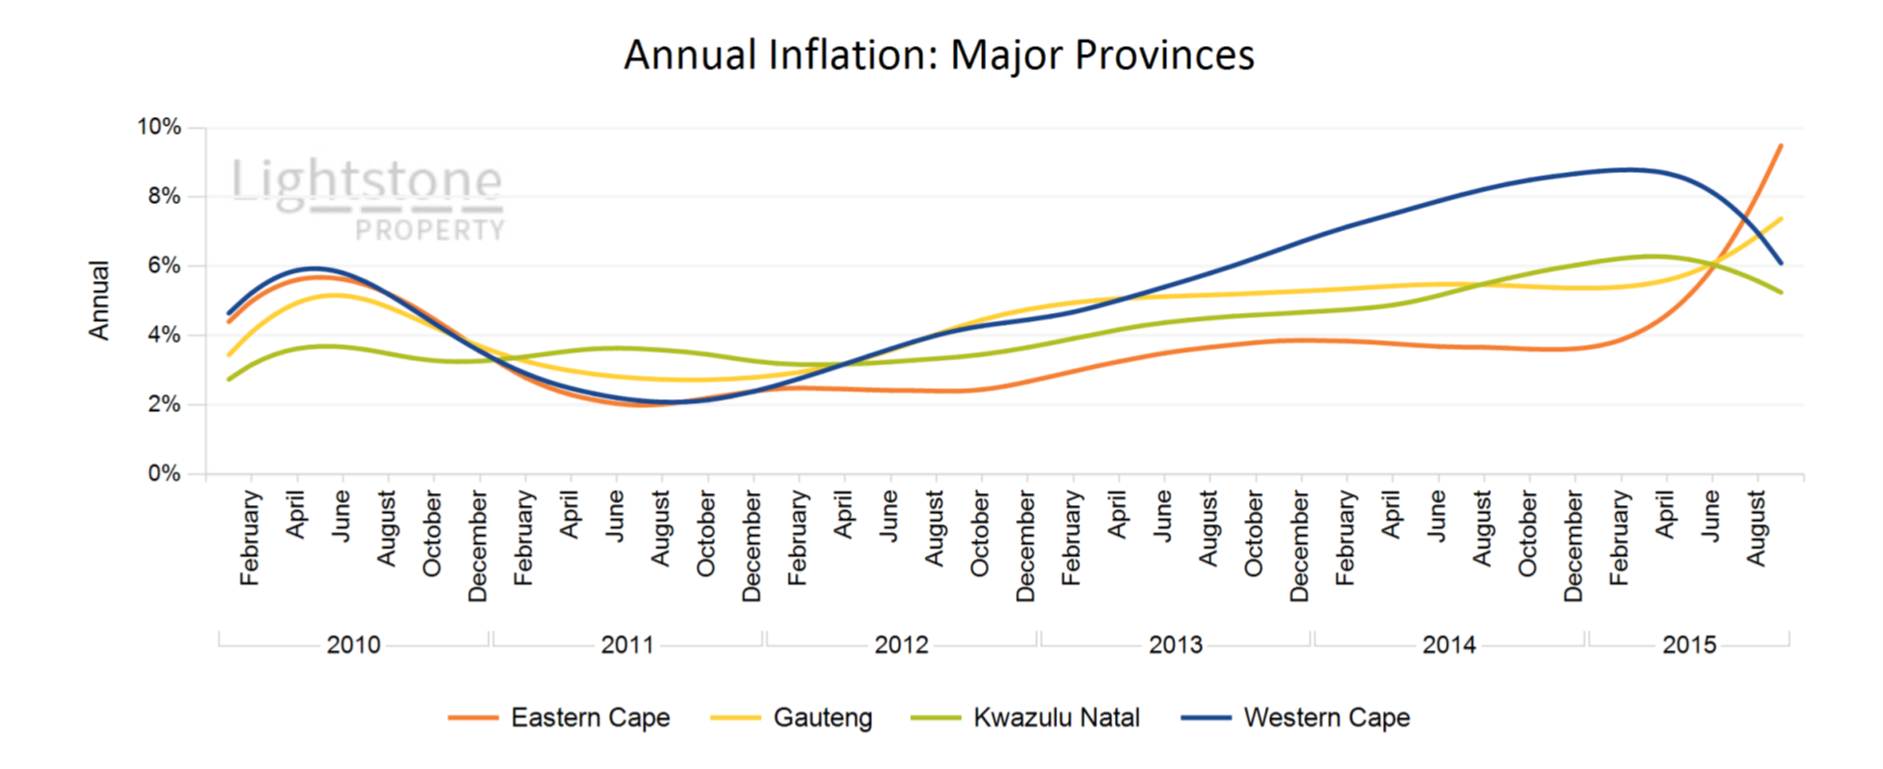
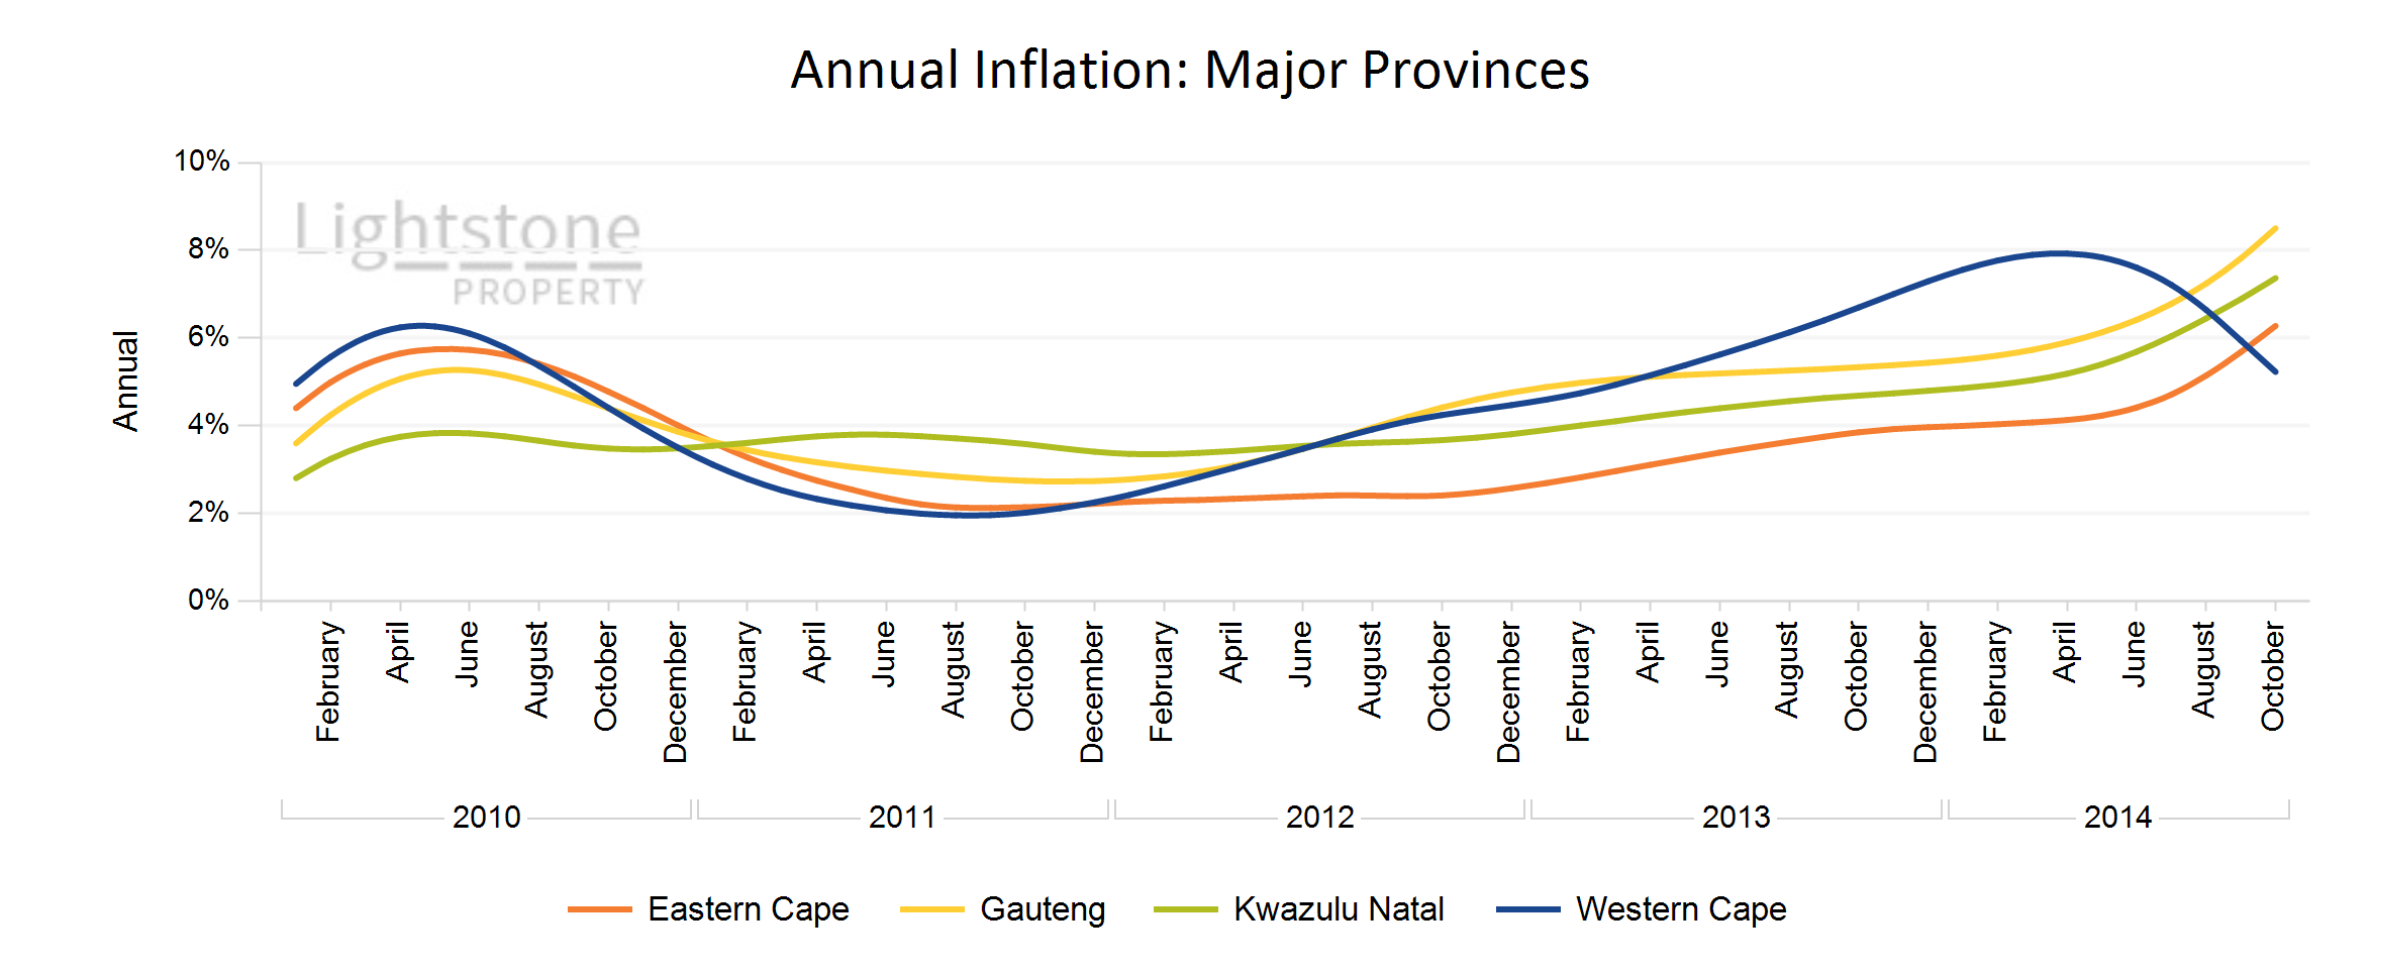
As at the end of November 2016 the national house price inflation was at 3.6%. Looking at the overall picture at provincial level it is evident the market has been slowing down over recent months and this is more pronounced in the Western Cape, Limpopo, North West, Free State and Mpumalanga provinces. KwaZulu-Natal maintains a steady growth of about 6% and the Eastern Cape is slowly picking up. Despite the slowdown in the Western Cape it still comes out second with a rate of 7.9% after the staggering 25.6% seen in the Northern Cape.
 October 2016
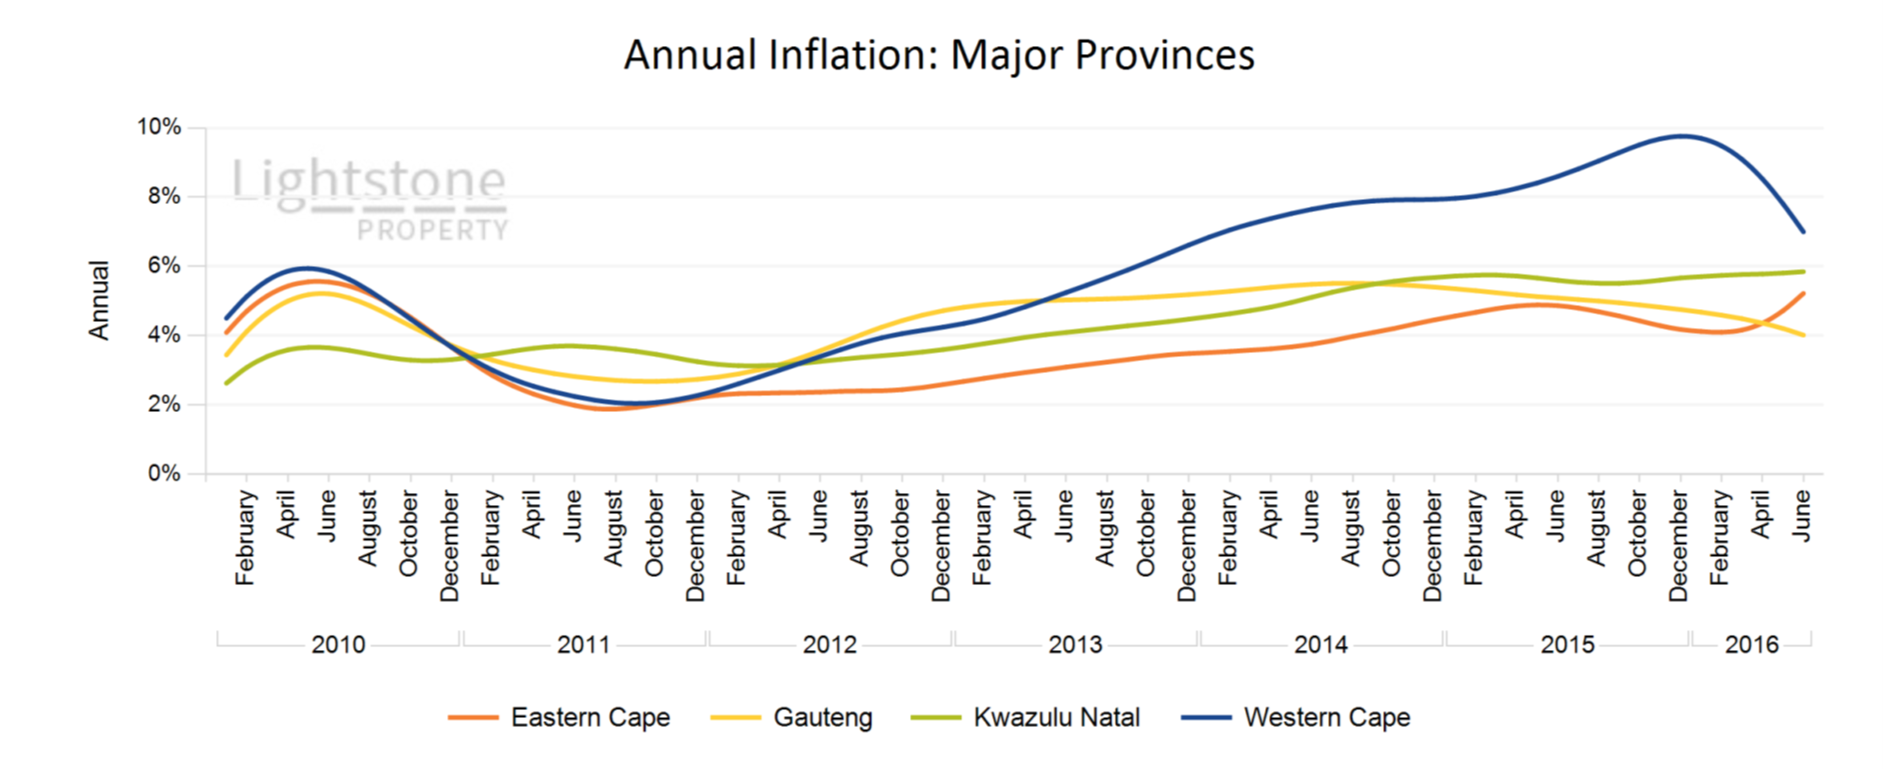
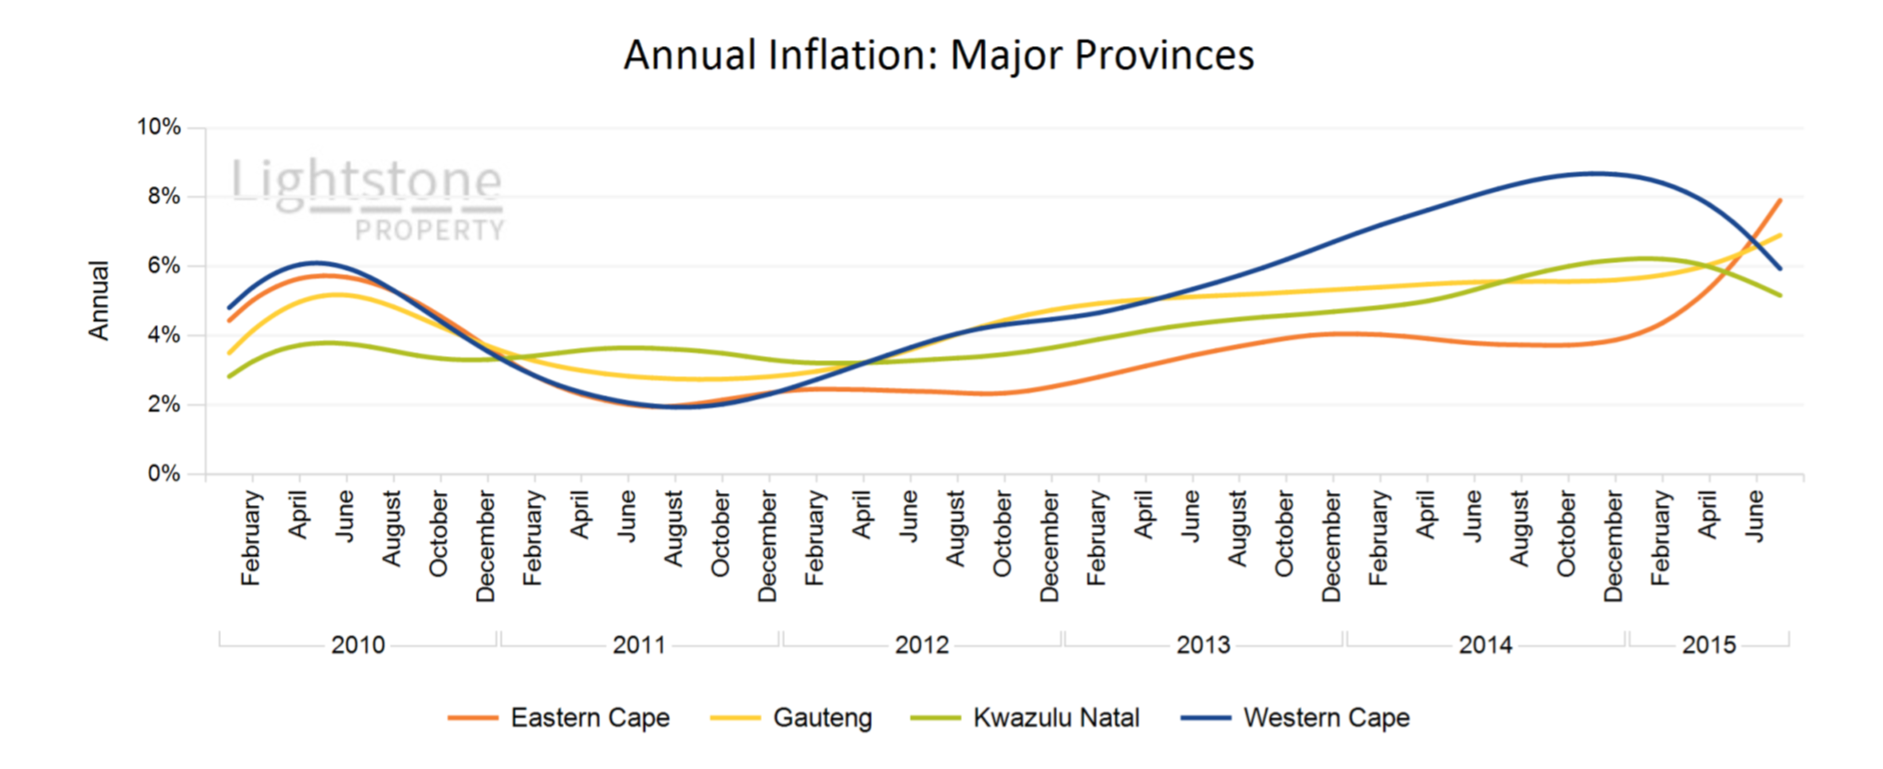
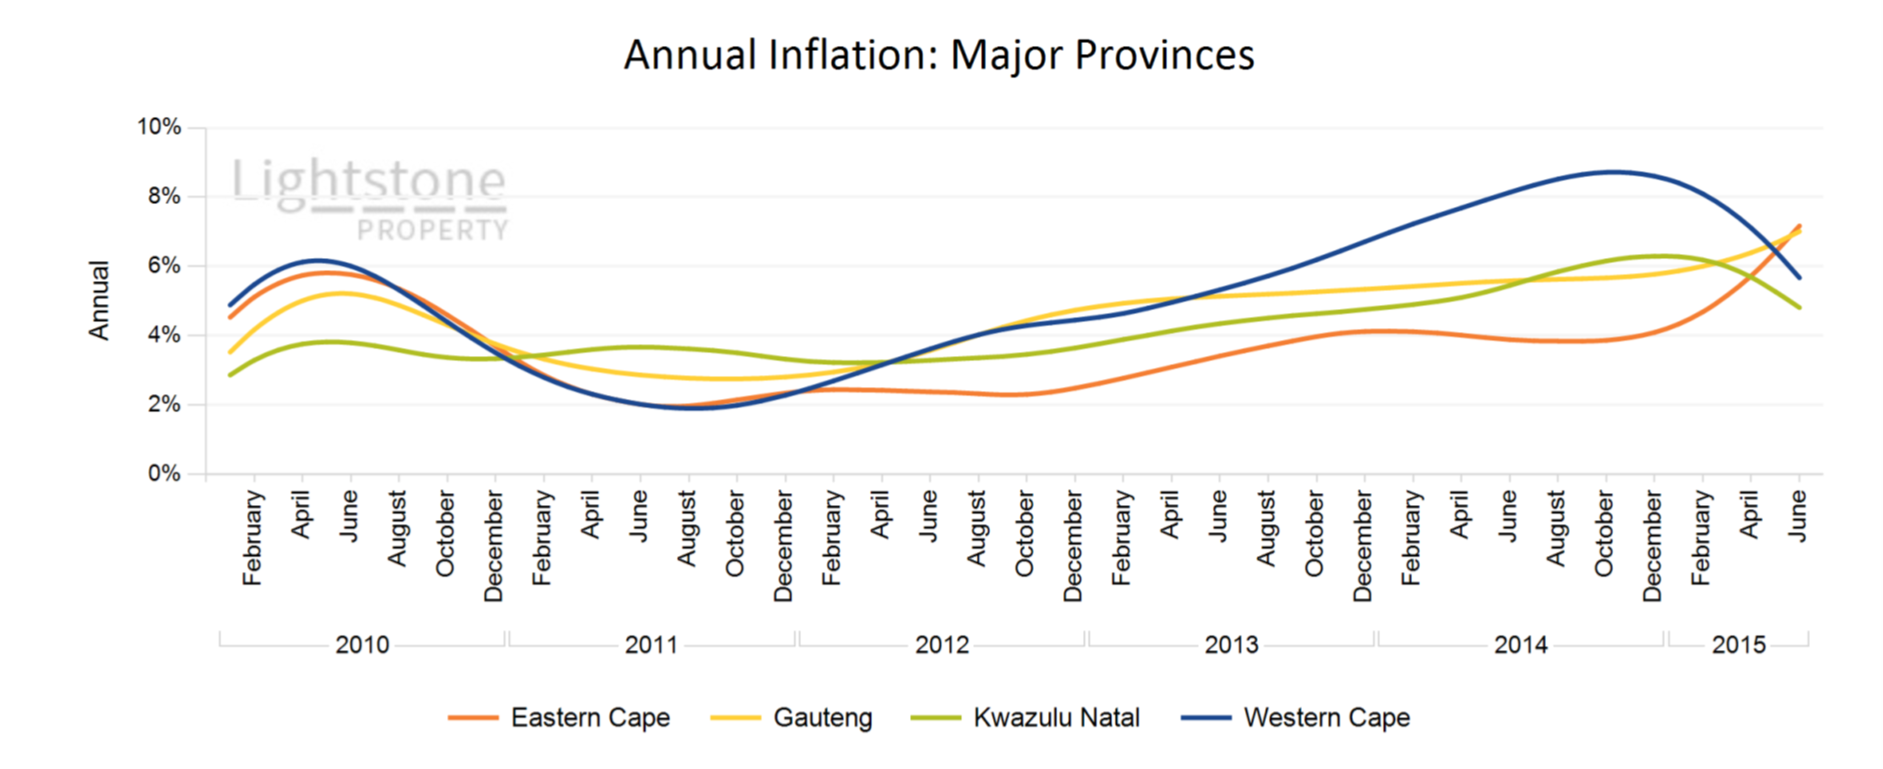
As at the end of August 2016 the national house price inflation was at 4.9%. Looking at the 4 major provinces it is evident the market has been slowing down over recent months and this is more pronounced in the Western Cape and Gauteng with KwaZulu-Natal maintaining a steady growth slightly less than 6% and the Eastern Cape slowly picking up. Despite the slow down in the Western Cape it still comes out on top with a rate of 7.9%.
 September 2016
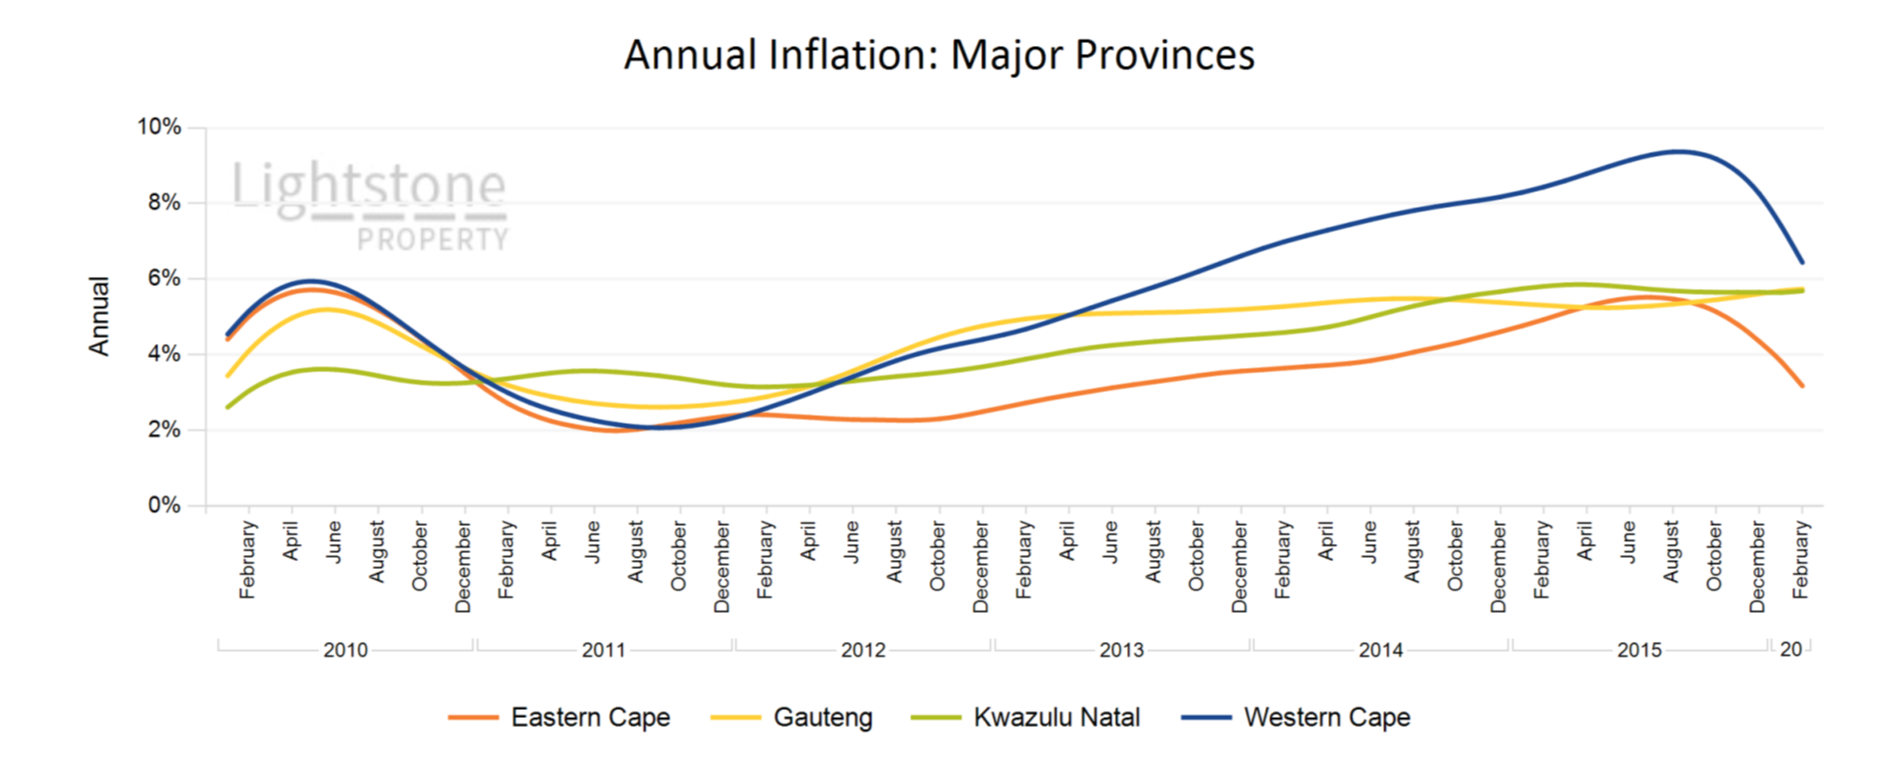
As at the end of August 2016 the national house price inflation was at 5.2%. Looking at the 4 major provinces it is evident the market has been slowing down over recent months. This is more pronounced in the Cape provinces with KwaZulu-Natal and Gauteng joining the trend. Despite the slowdown in the Western Cape it still comes out on top with a rate of 7.8%.
 August 2016
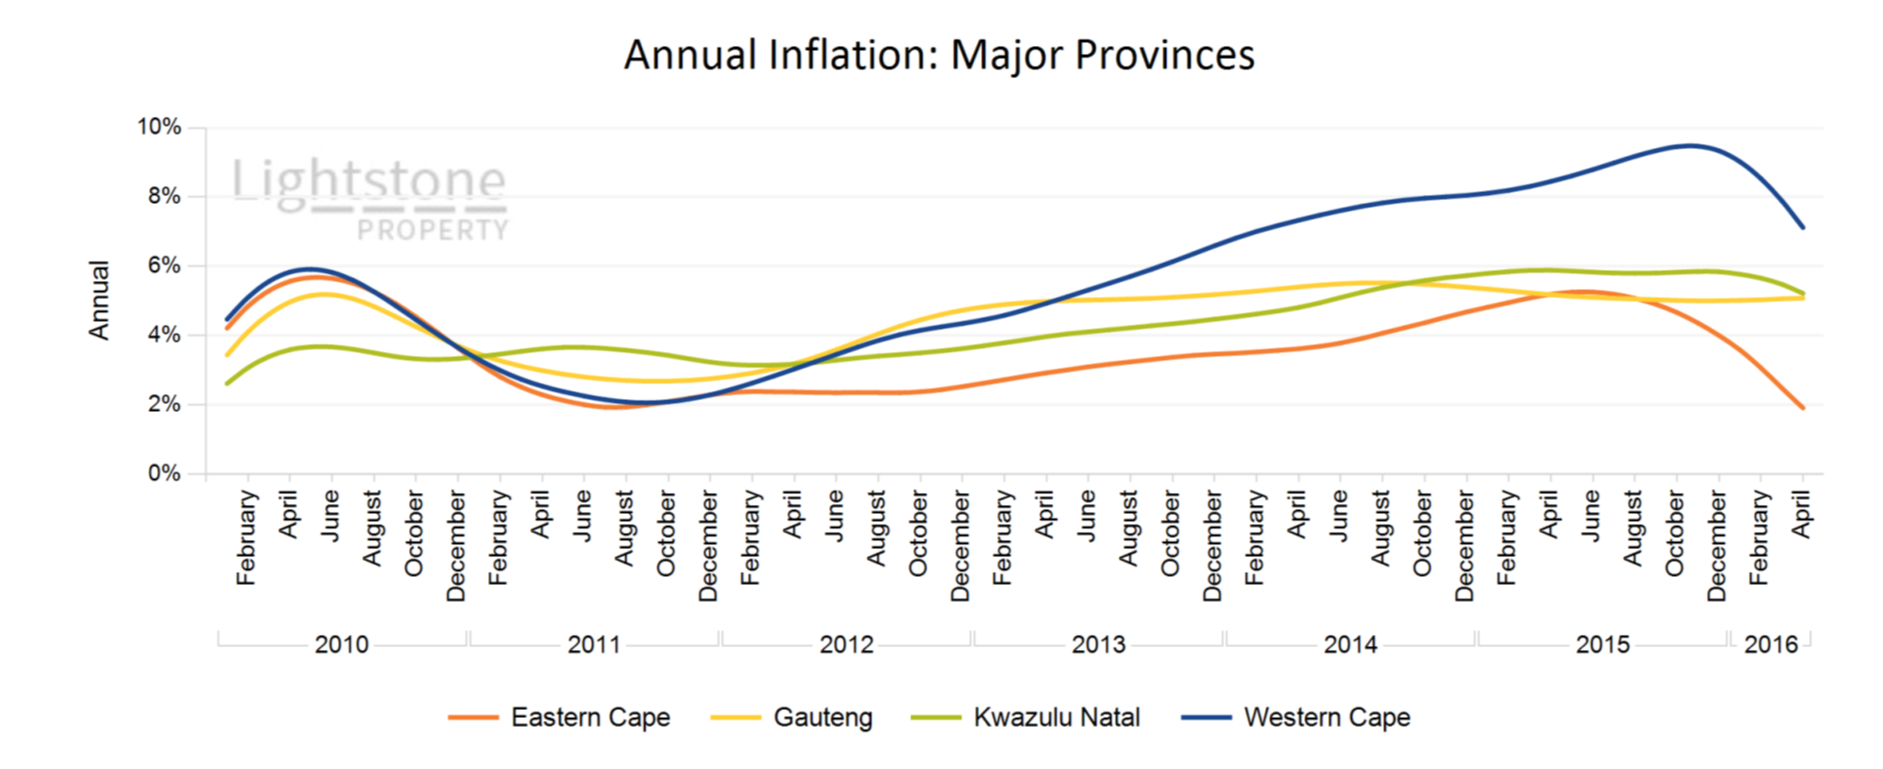
As at the end of July 2016 the national house price inflation was at 5.2%. Looking at the 4 major provinces it is evident the market has been slowing down over the most recent months and this is more pronounced in the Cape provinces with Gauteng joining the trend. Despite the acute slow down in the Western Cape it still comes out on top with a rate of 7.1%.
 August 2016
National house price inflation was 5.45% at the end of June 2016. Western Cape leads the provincial growth at a rate of 7.6%. Buoyant growth is still observed in Gauteng metro with Ekurhuleni, City of Tshwane and City of Johannesburg growing at a rate of more than 4%. While property inflation in Nelson Mandela Metro and Ethekwini continues to grow at roughly 4%, City of Cape Town continues to show exuberant growth at just above 10%. The Low and Mid value segments continue to buck the market trend by growing by more than 8% annually while the High and Luxury segments are inflating at a lower rate closer to 3% per annum.
 July 2016
National house price inflation was 5.27% at the end of May 2016 The Low and Mid value segments continues to buck the market trend by growing by more 8% annually while the High and Luxury segments are inflating at a lower rate closer to 3% per annum. We however still observe buoyant growth in Gauteng metro with Ekurhuleni, City of Tshwane and City of Johannesburg growing at more than 6%.
 May 2016
Annual house price inflation was recorded at 5.2% at the end of April 2016 and decreased by 0.1% from the previous month. Despite stable growth in the mid and low value segment, house price in the high and luxury segment continues to decrease.
 April 2016
House price inflation at the end of February 2016 was recorded at 5.2%. As has been seen over the past 6 months, house price inflation has slowly been declining.
 March 2016
House price inflation as at the end of January 2016 remains stable at 5.5%. The general tendency in the property market is that if national inflation increases, inflation in all value bands will increase. Similarly if national inflation decreases the general tendency would be for inflation in all the value bands also to decrease.
 February 2016
National house price inflation ended at 5.5% for the year of 2015, slightly below the Lightstone forecast. It is not expected that the current downward trajectory in house price inflation will come to an end in 2016 due to a looming recession and the sluggish growth experienced in 2015. Lightstone forecast 2016 property inflation to be less than in 2015 at 3.5%.
 February 2016
This is a new report that we are releasing to provide you with useful and relevant information that will guide you in fully understanding all the various indicators within the property market.
 December 2015
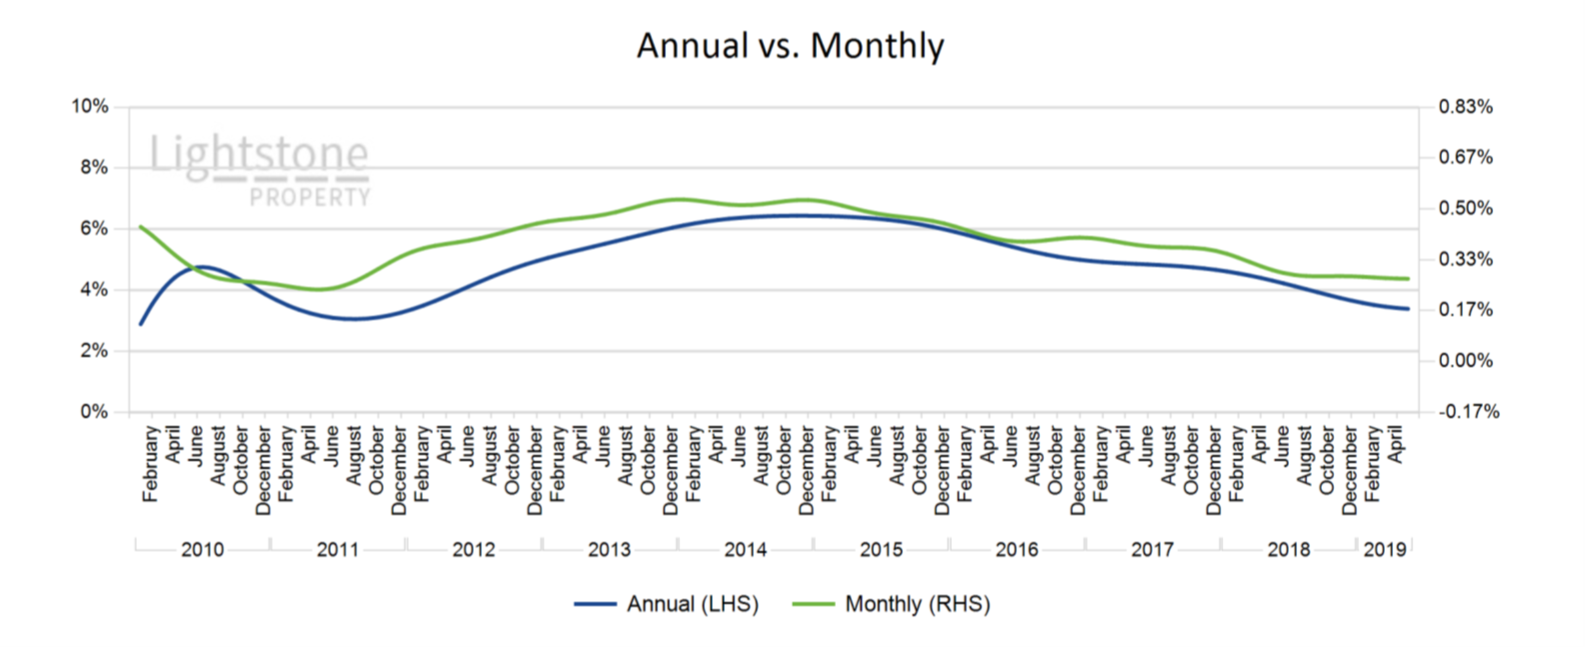
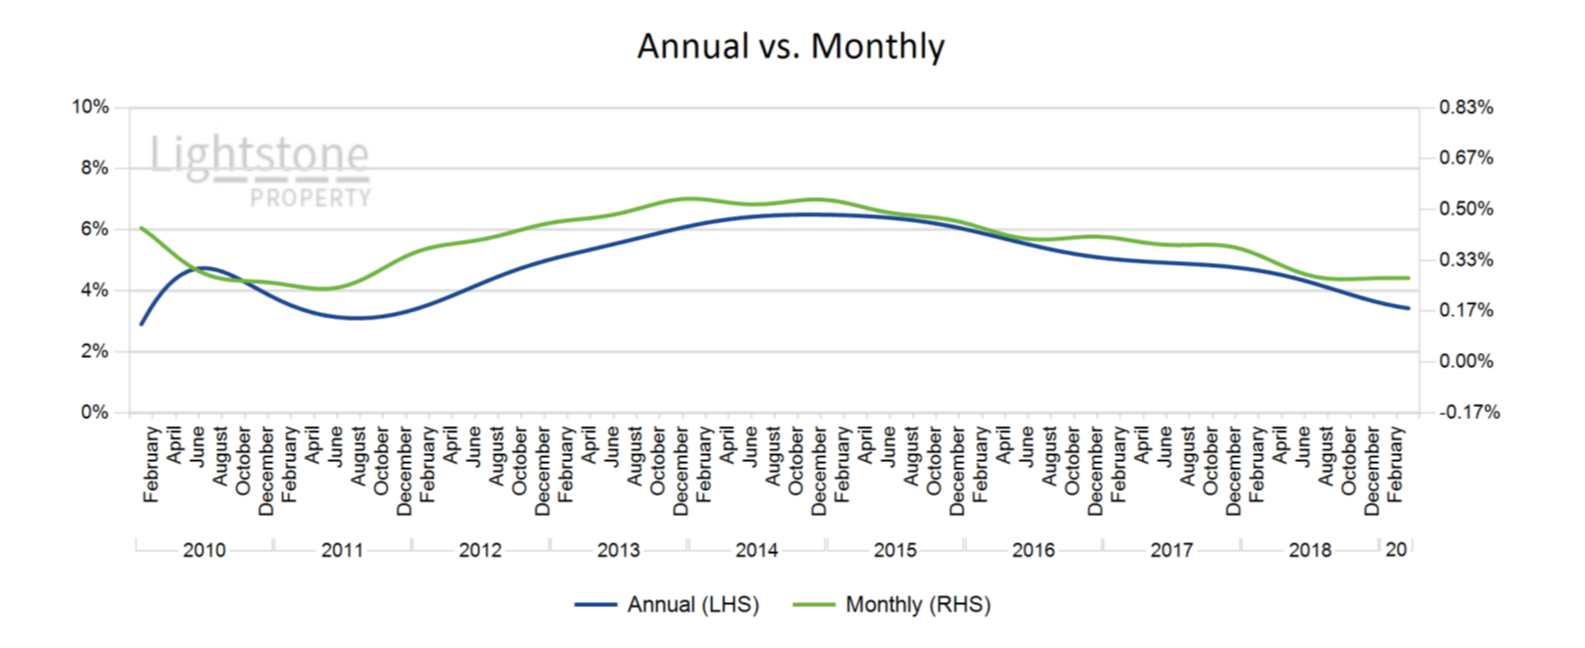
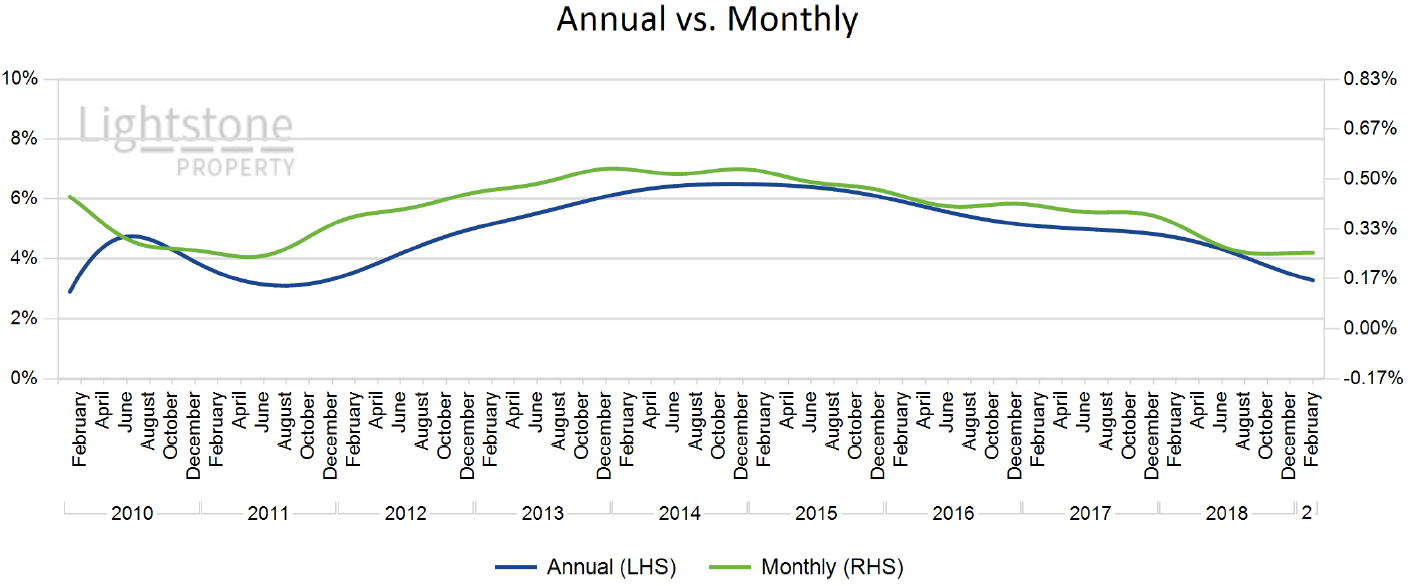
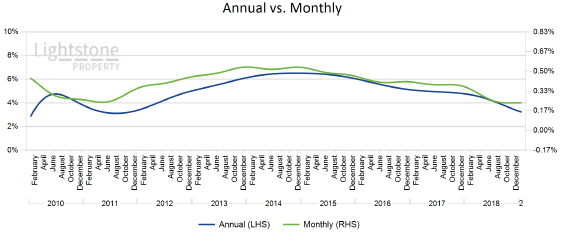
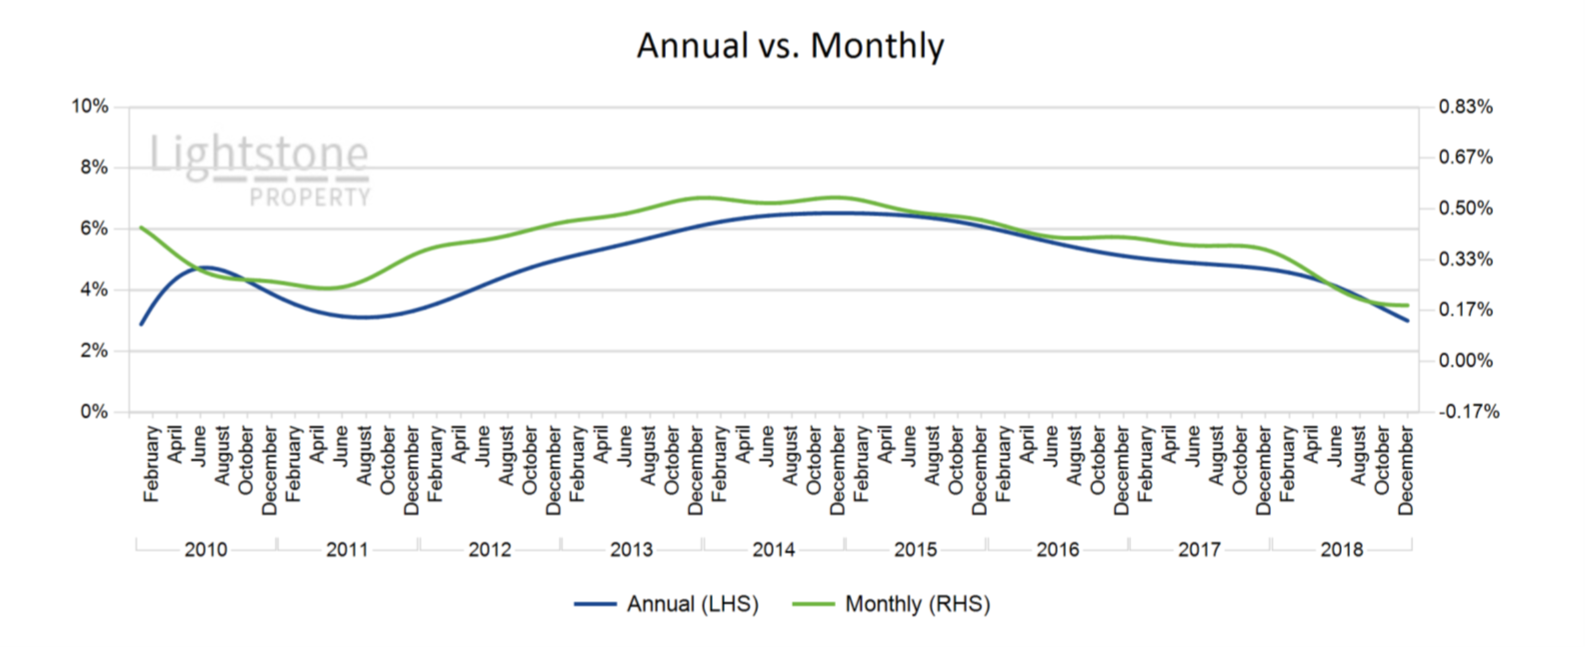
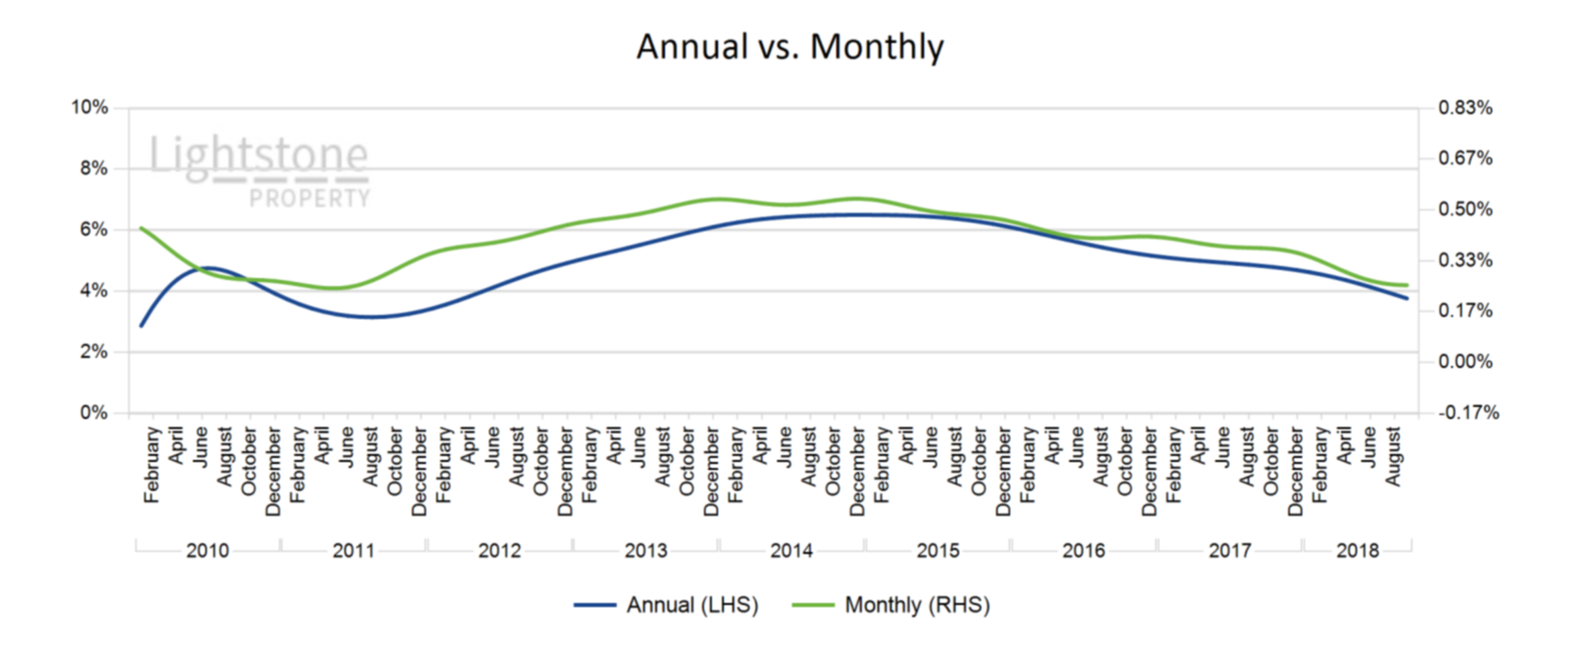
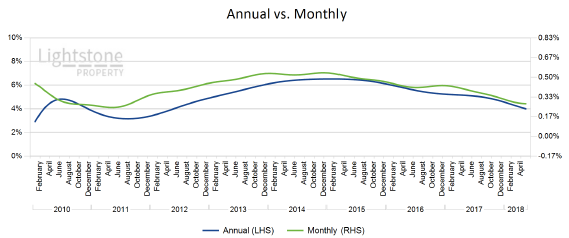
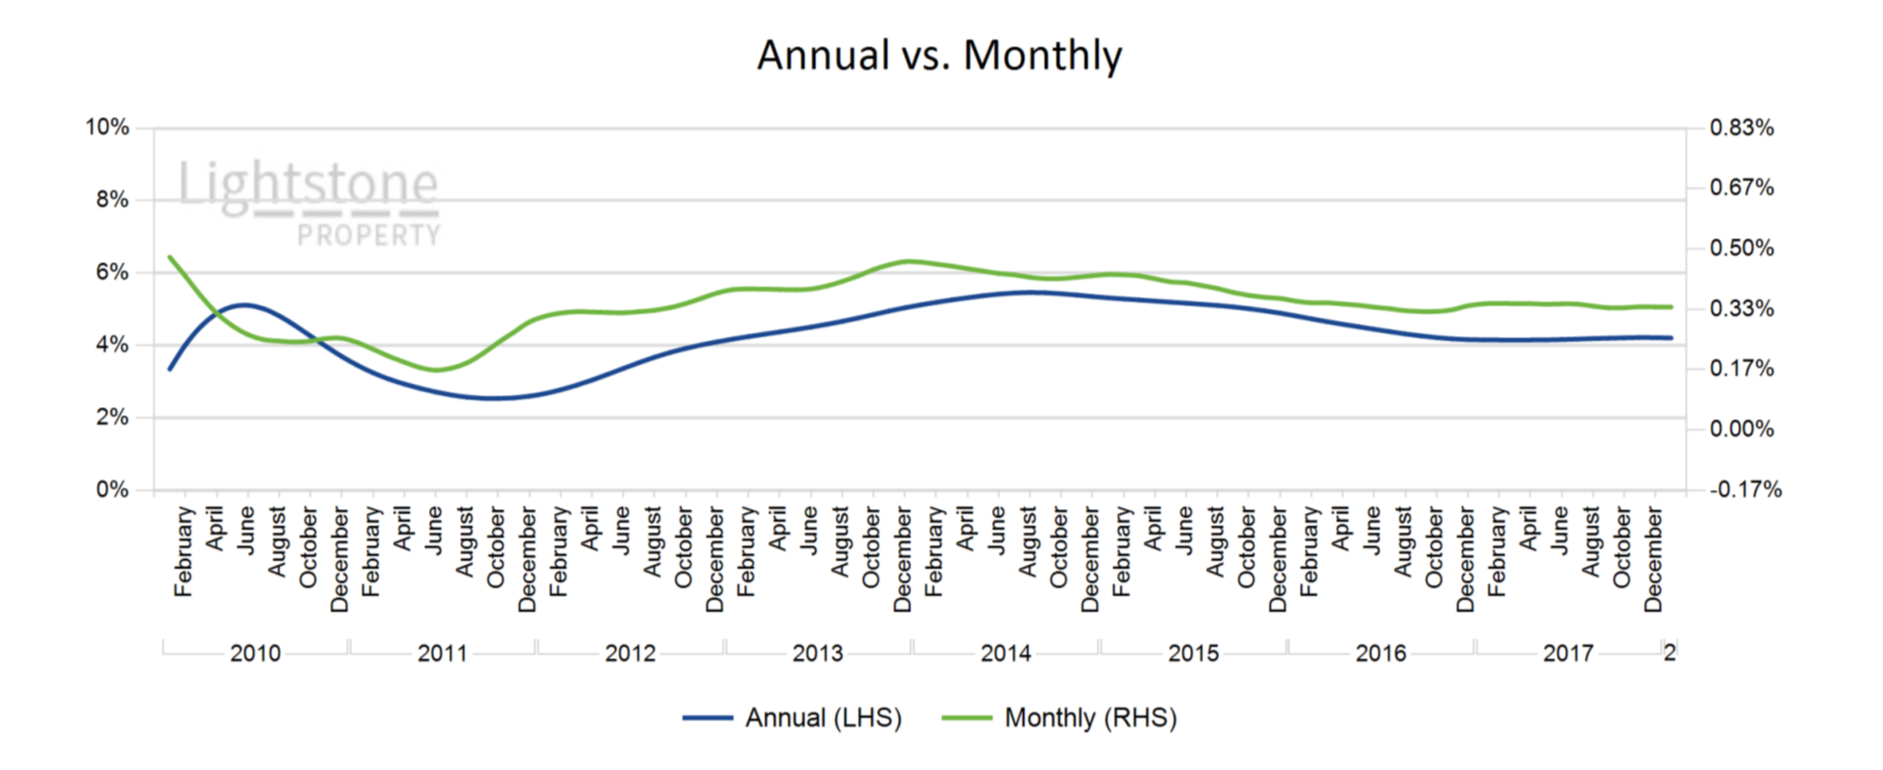
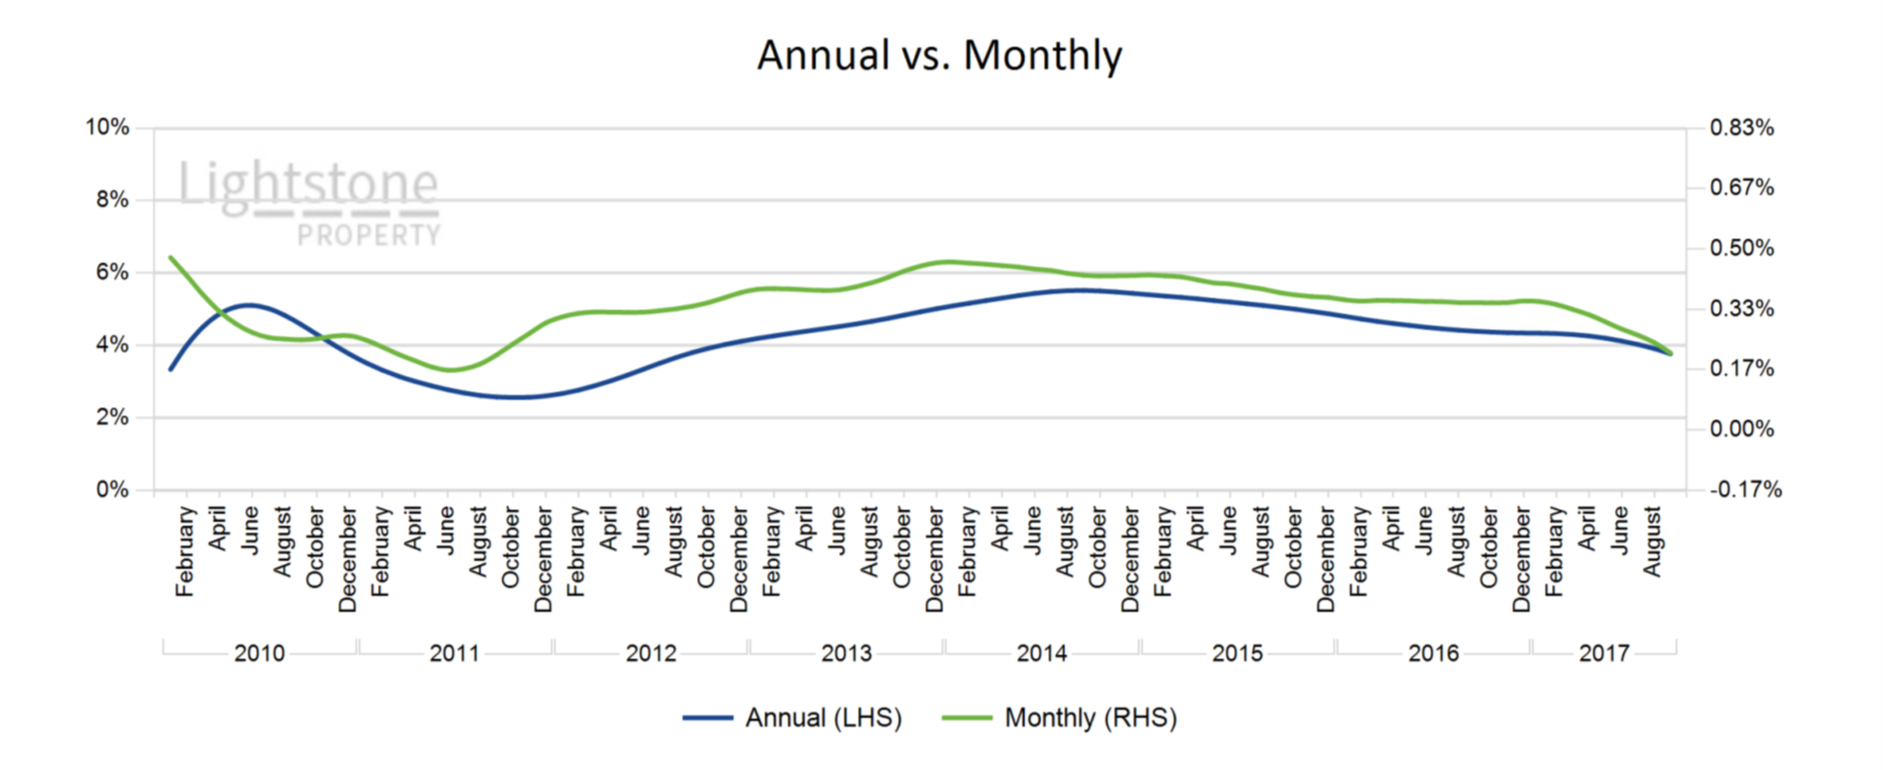
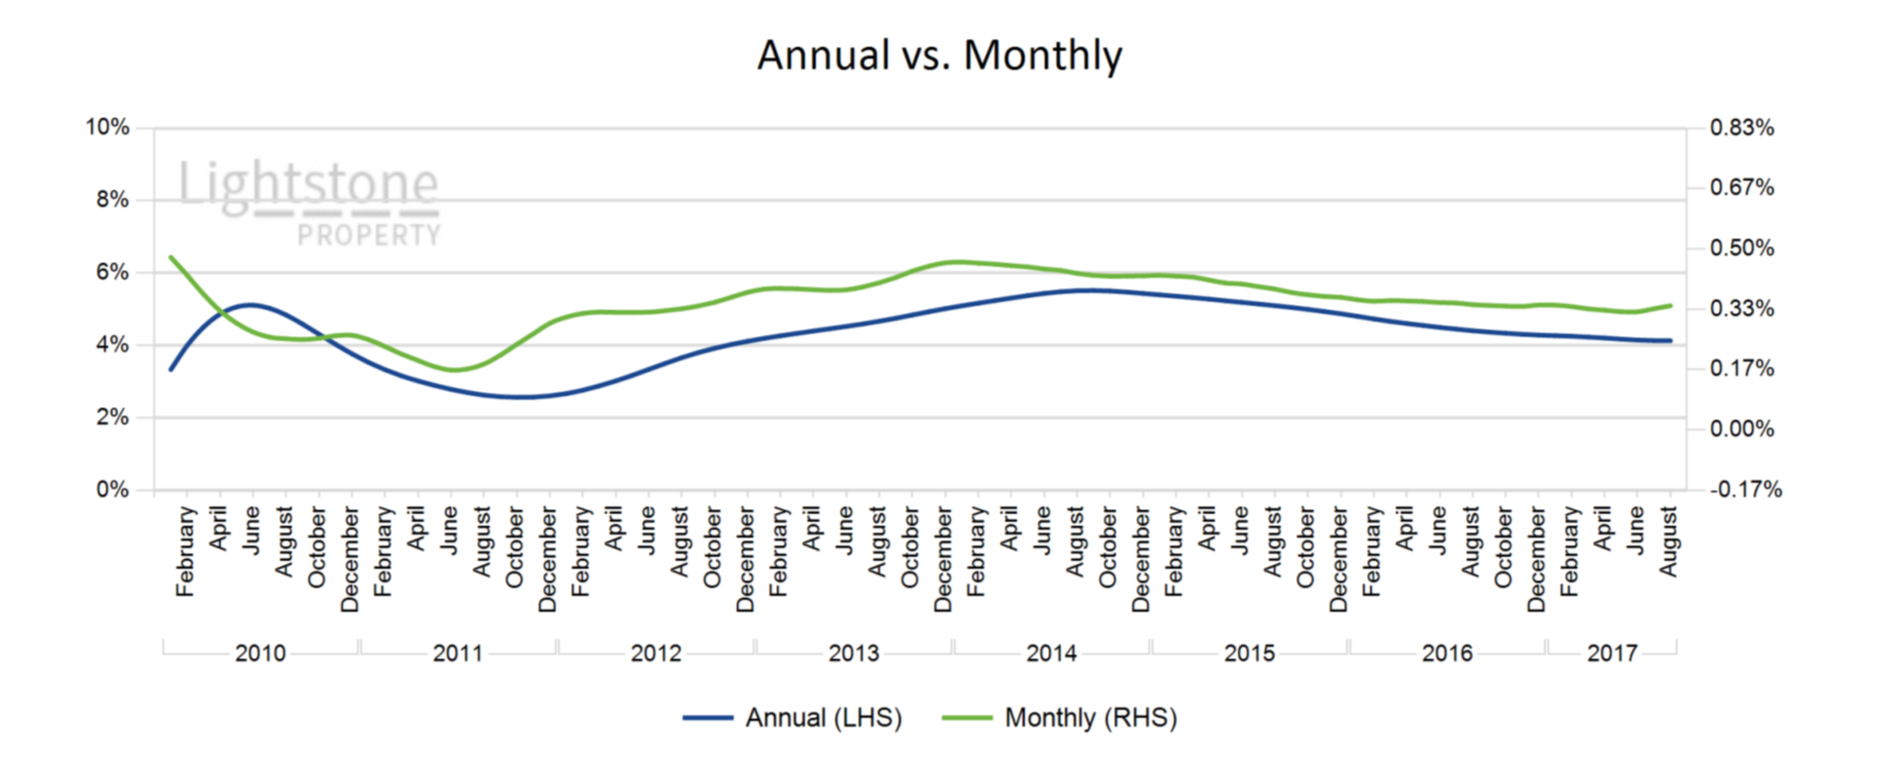
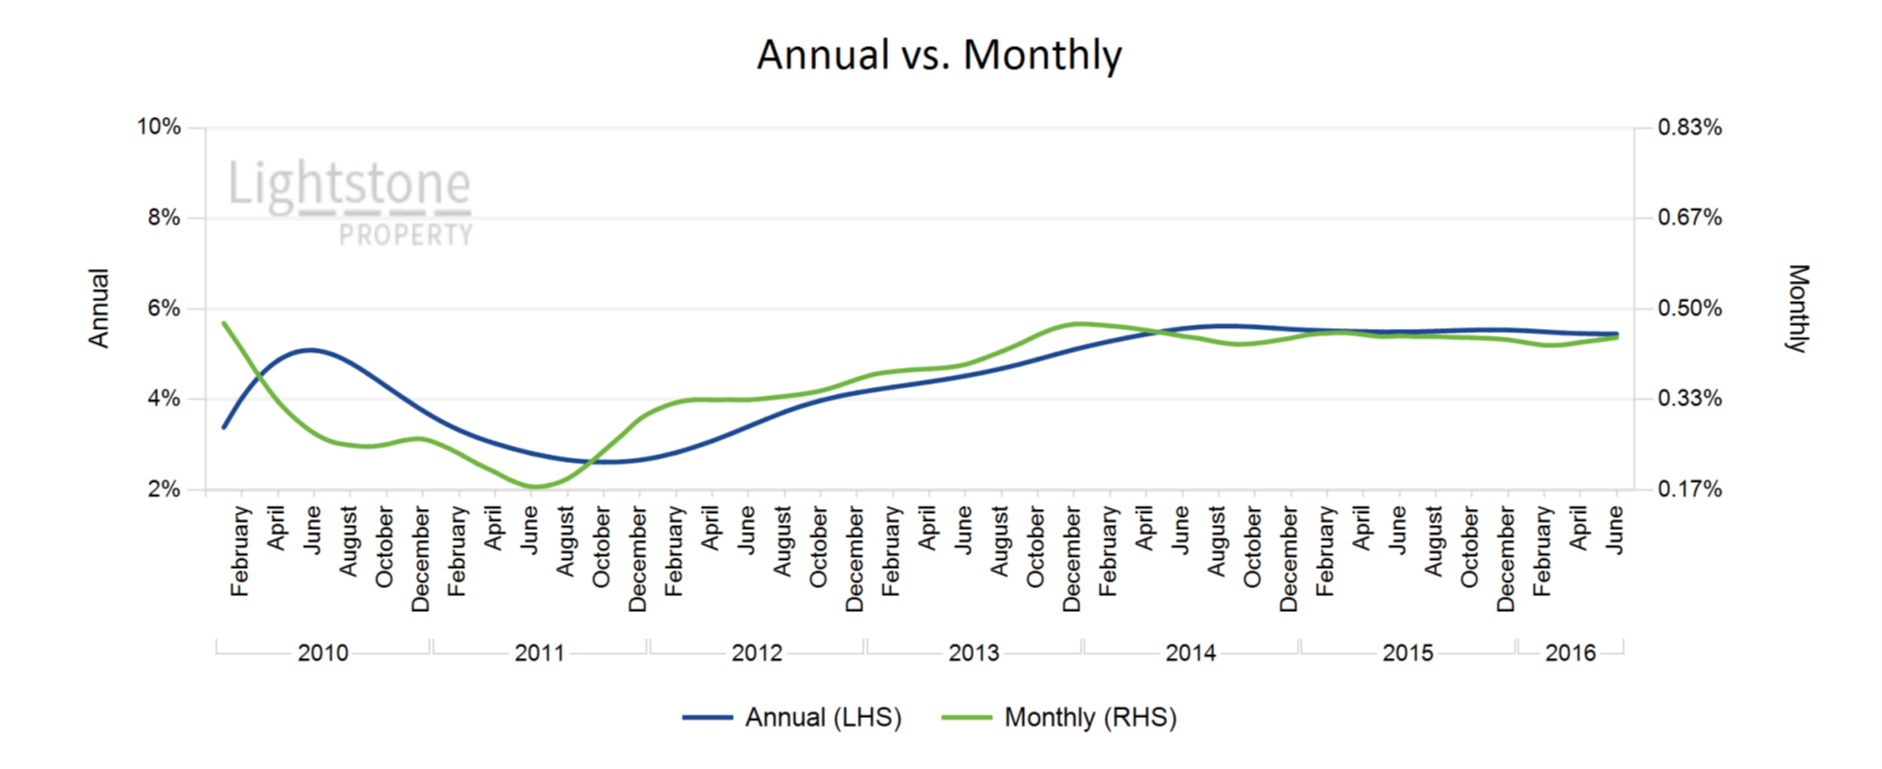
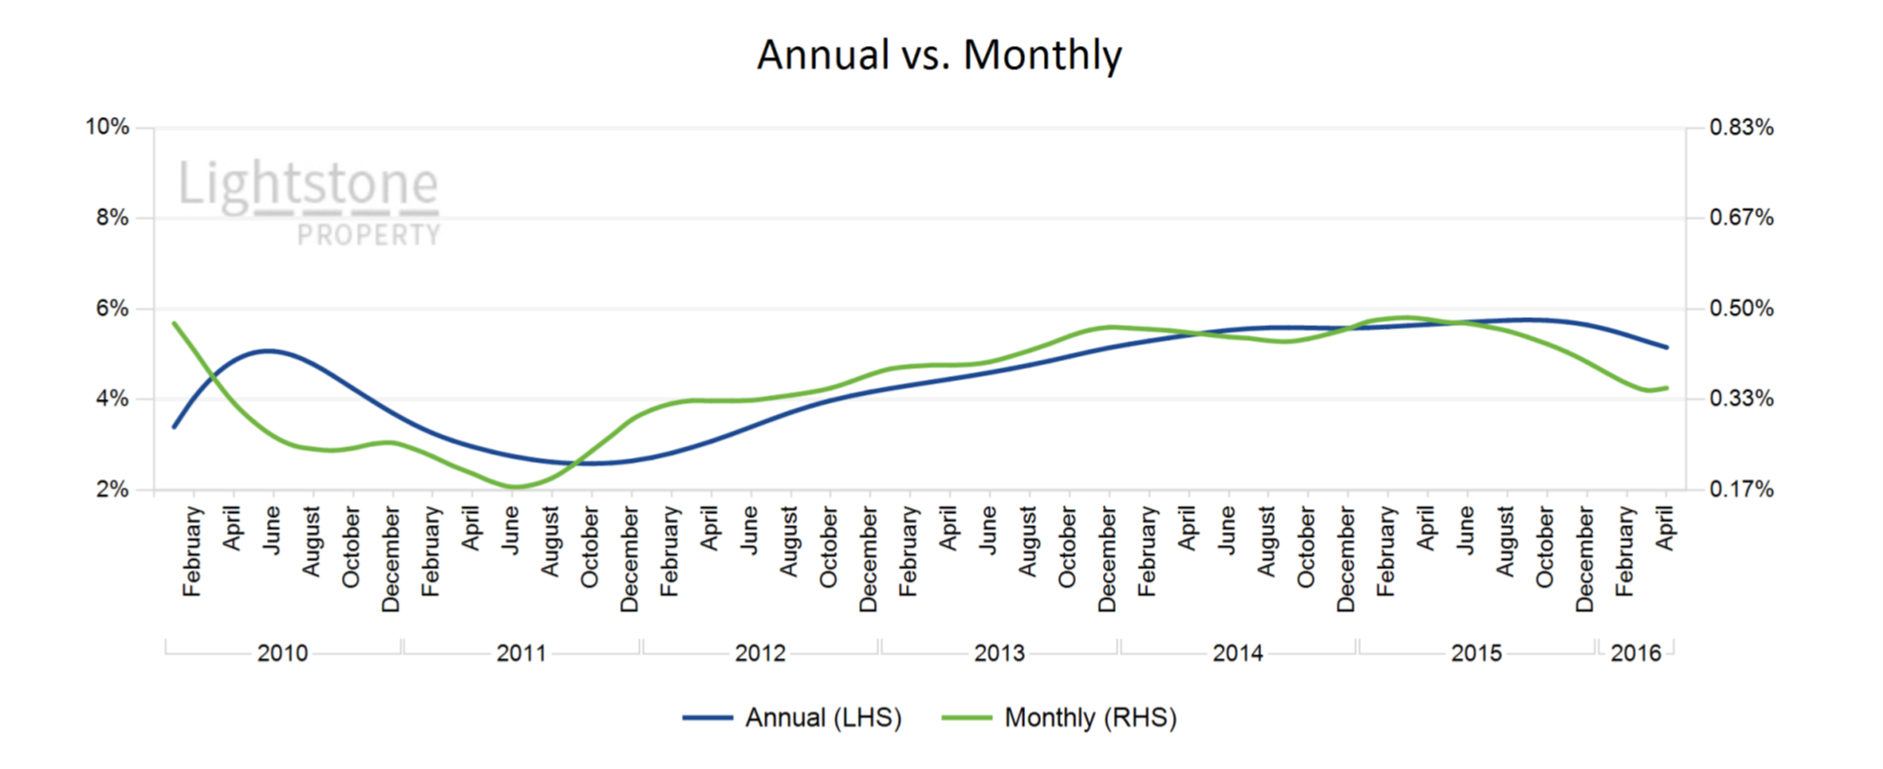
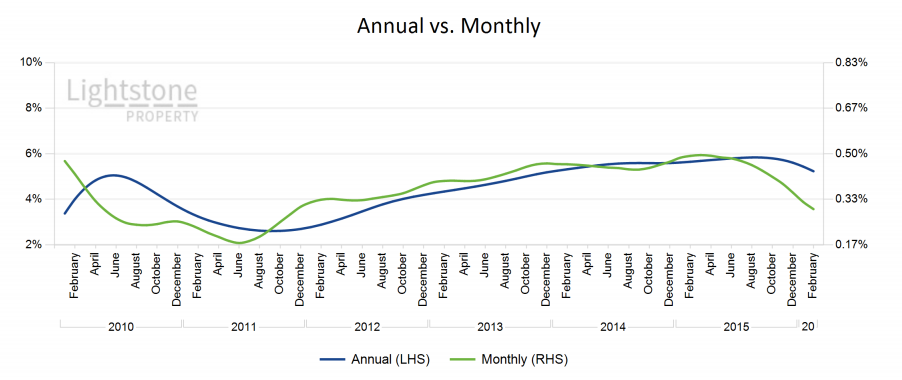
Current annual inflation rate is 5.58% and monthly is 0.32%
 October 2015
With all the major economic indicators down and South Africas credit ratings on the brink of being classified as rubbish, it is crucial for government to act decisively positive. Residential property is the primary investment vehicle for aspiring South Africans and political complacency and destructive economic policies which systematically destroy a healthy property market directly impacts the wealth generation capability of citizens.
 September 2015
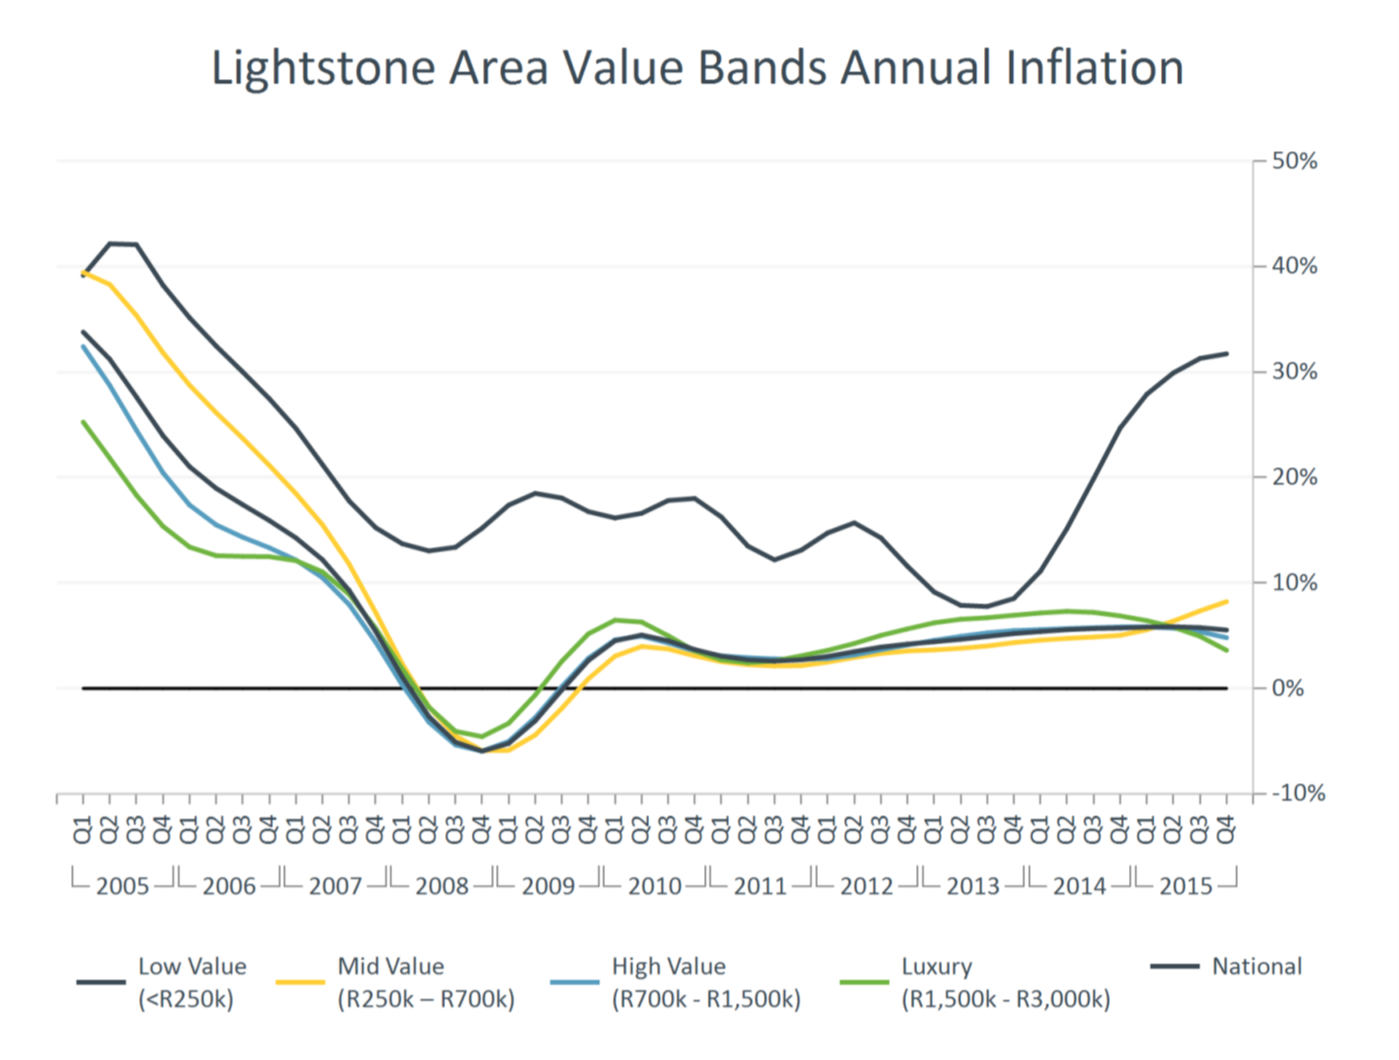
National house price inflation was recorded at 6% as at the end of August 2015. This figure has been slowly declining over the past 6 months primarily due to reduced growth in the luxury and high value segment. House price inflation in the mid and low value segment is however still increasing and it at 8.4% and 35.9% respectively. A common trend often observed in the property market is that the luxury segment leads the market through peaks and troughs before the other segments catch up and we therefore expect the mid and low value segments to also peak over the next 12 months.
 August 2015
The stock scarcity in most markets has largely corrected itself after the upswing in building plans passed during 2013 and 2014 and with consumer confidence indices showing a sharp decline we don't expect the double digit growth in building plans passed to continue for much longer. The latest shock in the exchange rate will put more pressure on CPI, which might prompt the reserve bank to be a bit more aggressive in the upward interest rate cycle.
 July 2015
National house price inflation was recorded at 6.0% at the end of June 2015. This figure was slightly down from the previously months estimate of 6.1%. This slowing in house price inflation is in line with what we currently see in the rest of the property market. The first signs of this reduction in property inflation was first seen in 2013 when the Lightstone Luxury value bands inflation peaked at roughly 6.9%. This value bands year on year inflation has been decreasing by more than 1.0% per annum and is currently at 4.0%.
 June 2015
The residential mortgage finance market remains one of the most important factors considered by the monetary policy committee when looking at controlling consumer price inflation. Not only does the reserve bank look at the growth in lending and the impact of potential interest rate changes on disposable income, but it also evaluates data from Lightstone on the trends in asset price growth, loan to values, distressed sales factors and average market risk quality.
 May 2015
The number of building plans passed is increasing and this may lead to the current stock shortage being corrected in the coming year. The trend in 2014 shows that there was an increased proportion of higher valued properties trading every quarter indicating that there might be a small portion of the low and middle market buyers trickling into and increasing activity in the higher value markets. This increased activity might also lead to some price growth recovery in the coming months. A less positive trend is that the average holding period in the highest value market segment seems to be declining which may indicate that downscaling is taking place in this market.
 April 2015
Residential property speculation seems to be at its lowest levels in more than a decade. During the previous housing boom, it was not uncommon to hear of speculators, renovators and investors buying properties, fixing them up and selling them for a profit. This has reduced significantly in the past five years. Between 2004 and 2007, nearly 50% of transacting properties had been bought less than four years earlier. 37% of properties that were sold during that time had been bought within the past two years indicating that many of these properties were bought with the intent of being sold in the near future at a profit.
 March 2015
Market activity is still slowly picking up with total transfer value of over R60 billion per quarter for the last 2 quarters of 2014. New stock supply seems to be growing in the Western Cape with the number of newly registered properties steadily rising in 2014. Coming off a low base, the Northern Cape continues its hot streak of double digit price growth, and the supply of new stock is not picking up in the province indicating that the demand/supply imbalance will keep price growth buoyant.
 February 2015
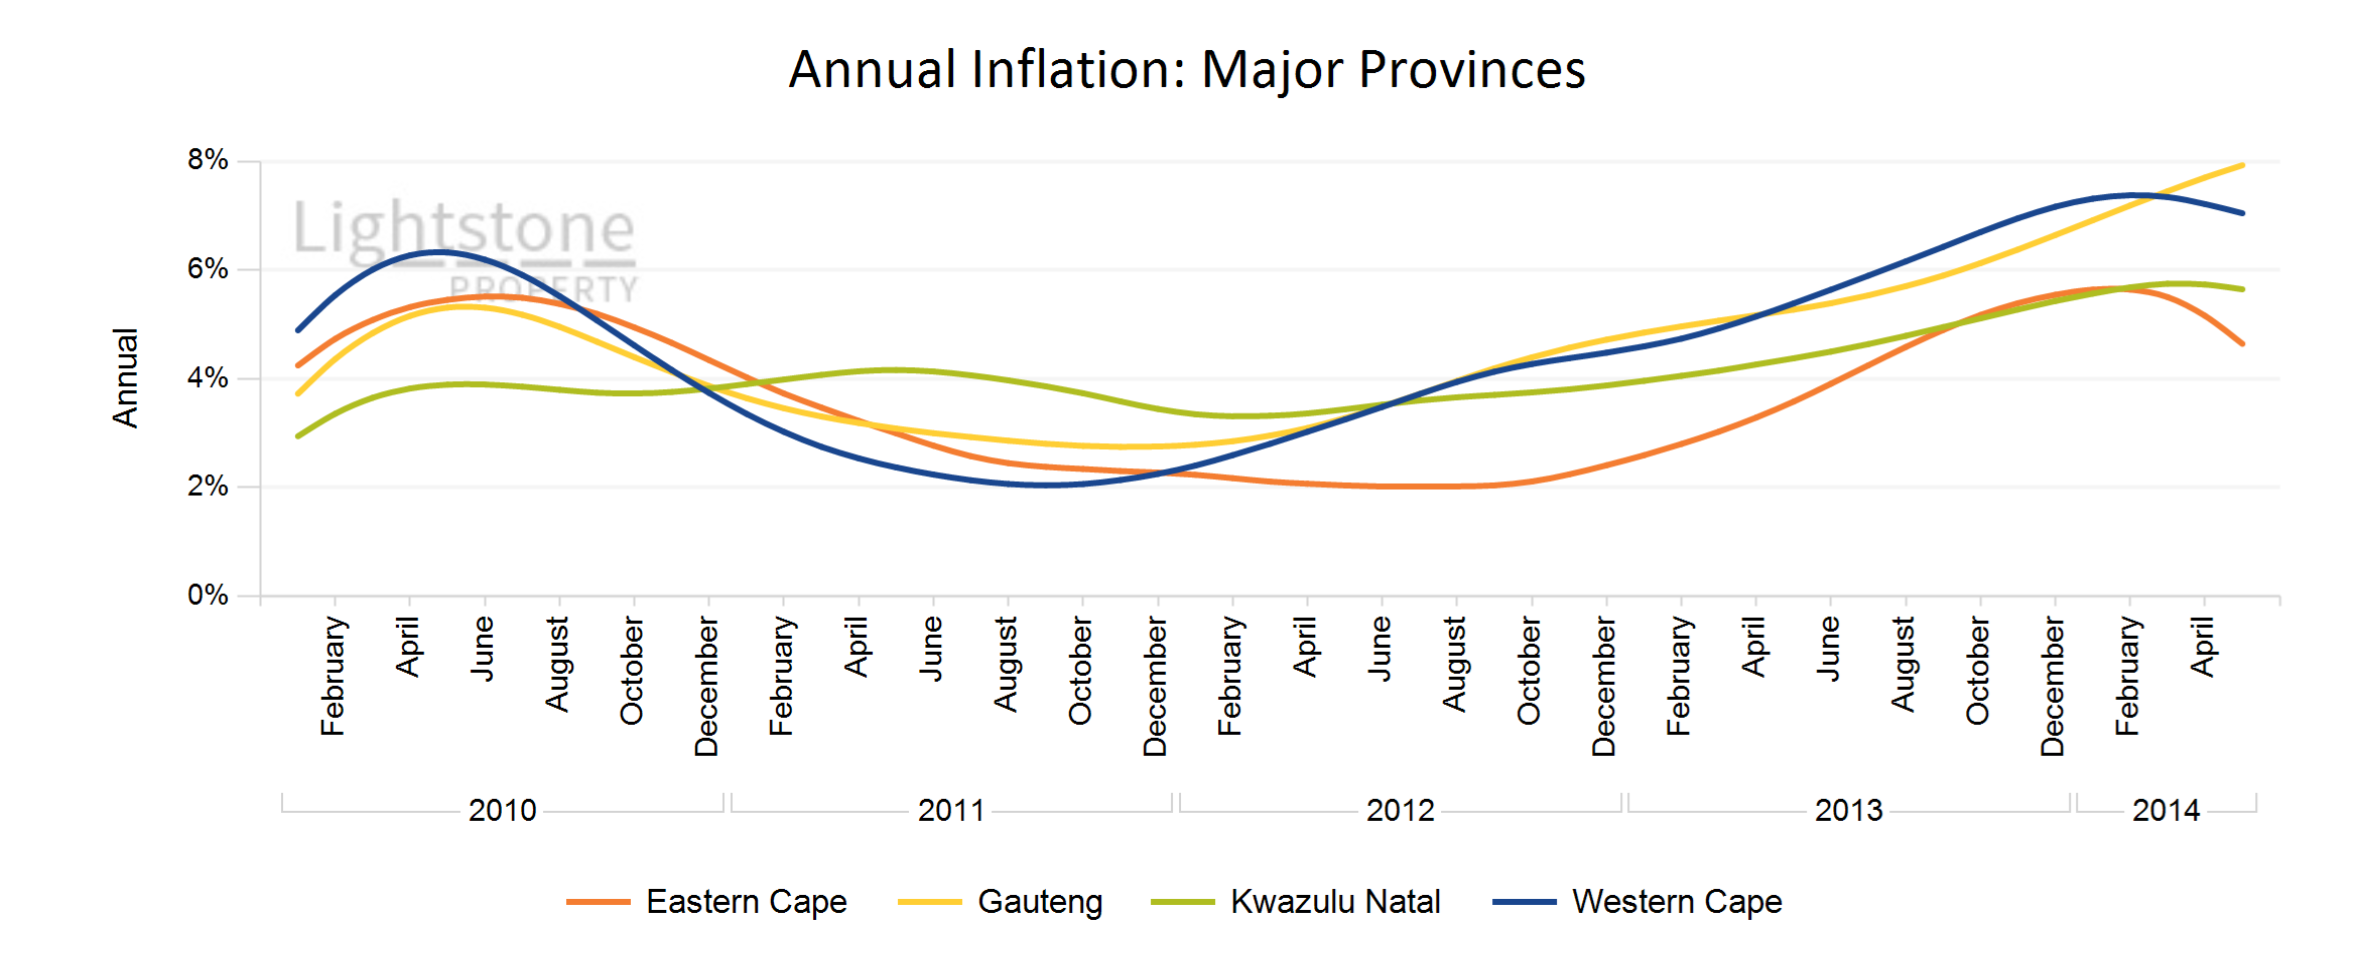
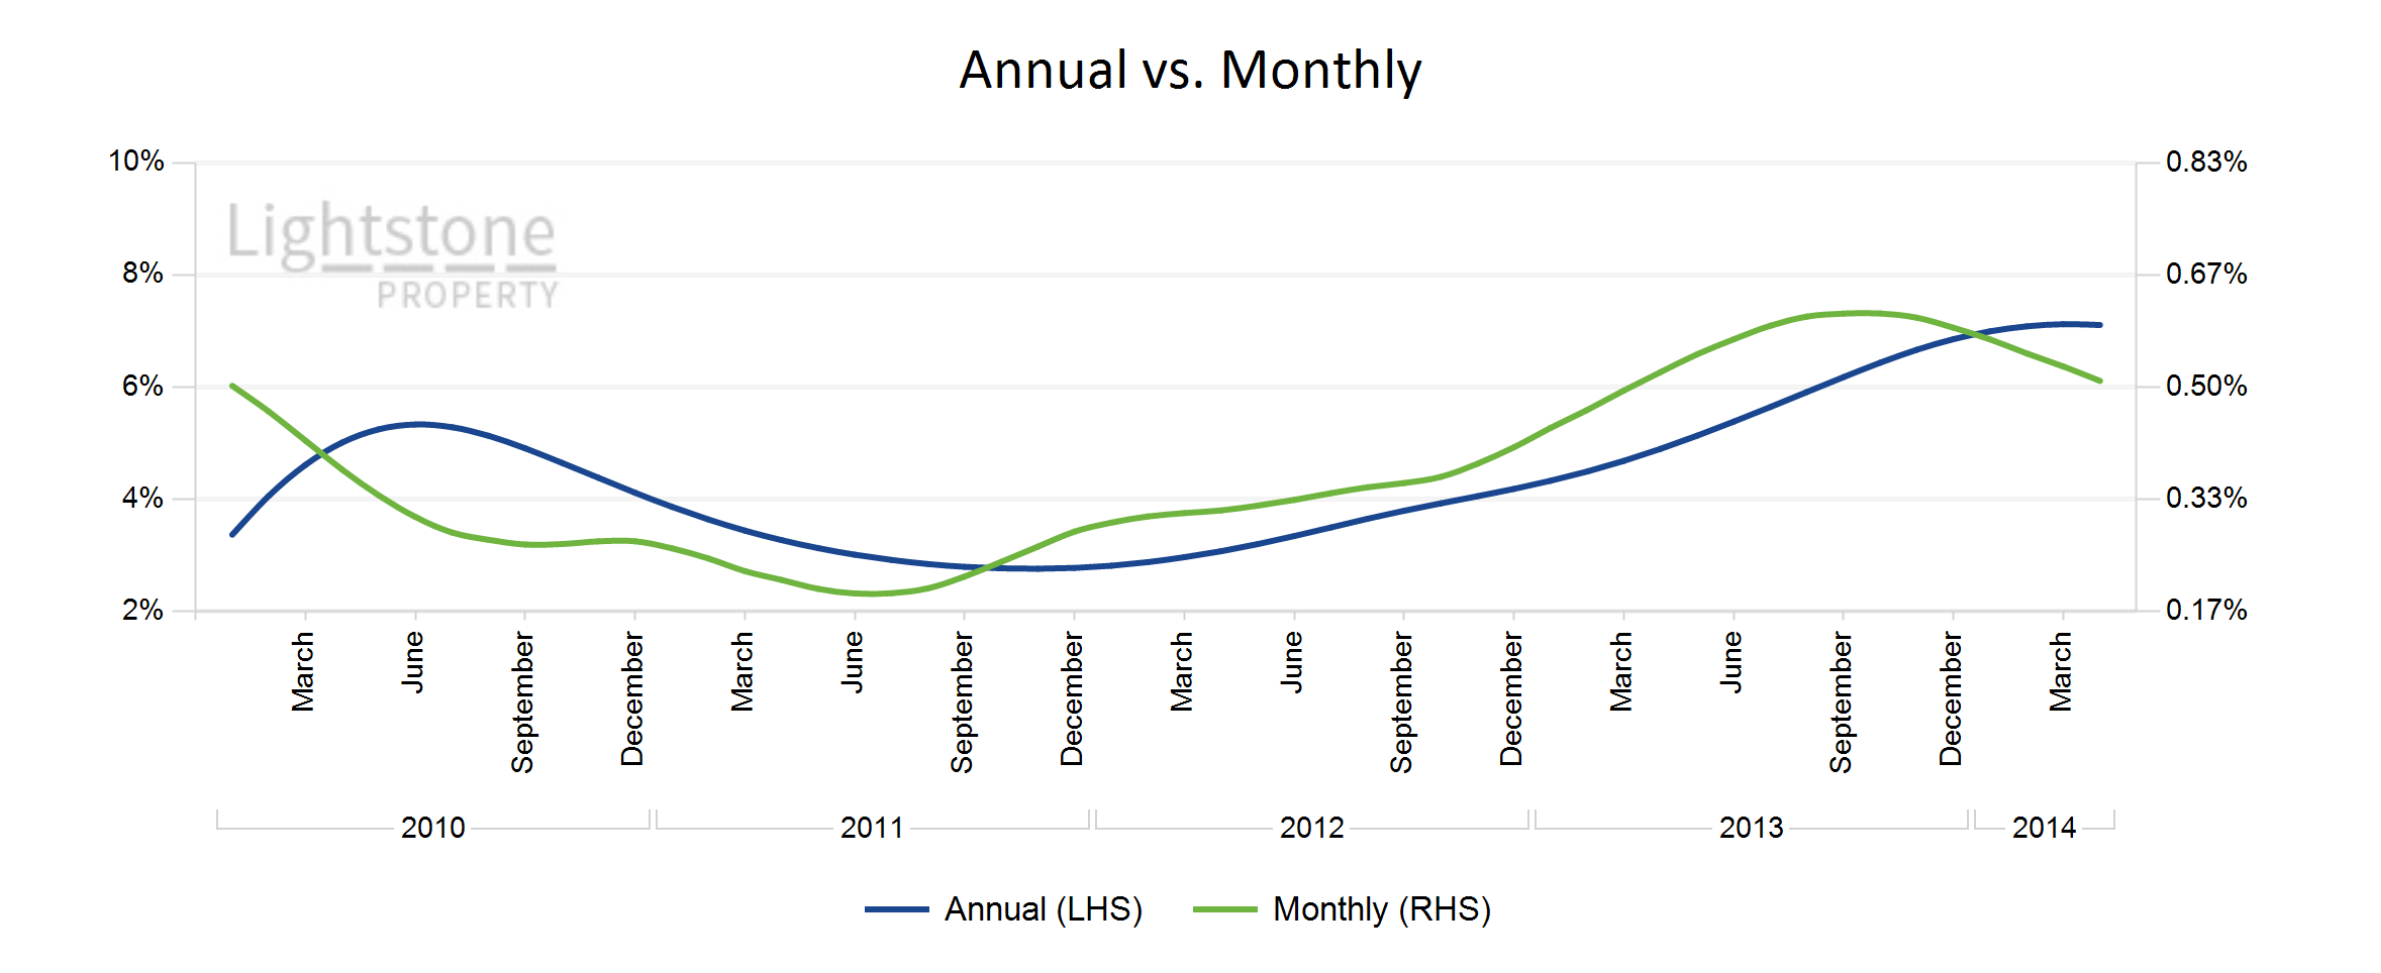
In February 2014, Lightstone forecasted that South African house price inflation will end at around 6.7%. In 2015, we expect this to decrease to 5.8%. In the event of more favourable economic conditions this figure can edge up to 7.3% while adverse conditions could see house price inflation closer to 3.5%. Lightstone forecasted that the property market would reach a peak in 2014. This prediction realised in the luxury value segment which peaked in the first quarter of 2014 at an annual inflation rate of 7.1%. The subsequent 11 months has seen a steady decline in this segment and was recorded at 5.3% in January 2015.
 January 2015
2014 ended on a stable note with national residential inflation at 6.72% (0.02 percentage points of the 6.7% that Lightstone forecasted in January 2014). The winning market is still the low end affordable sector and we expect this to continue as most mortgage lenders and estate agents aim to further penetrate this market. Weve seen a sharp turn in inflation of the highest value markets, but due to low transaction volumes in this market, we remain cautiously optimistic that it will not have a major capital deteriorating effect before picking up again.
 November 2014
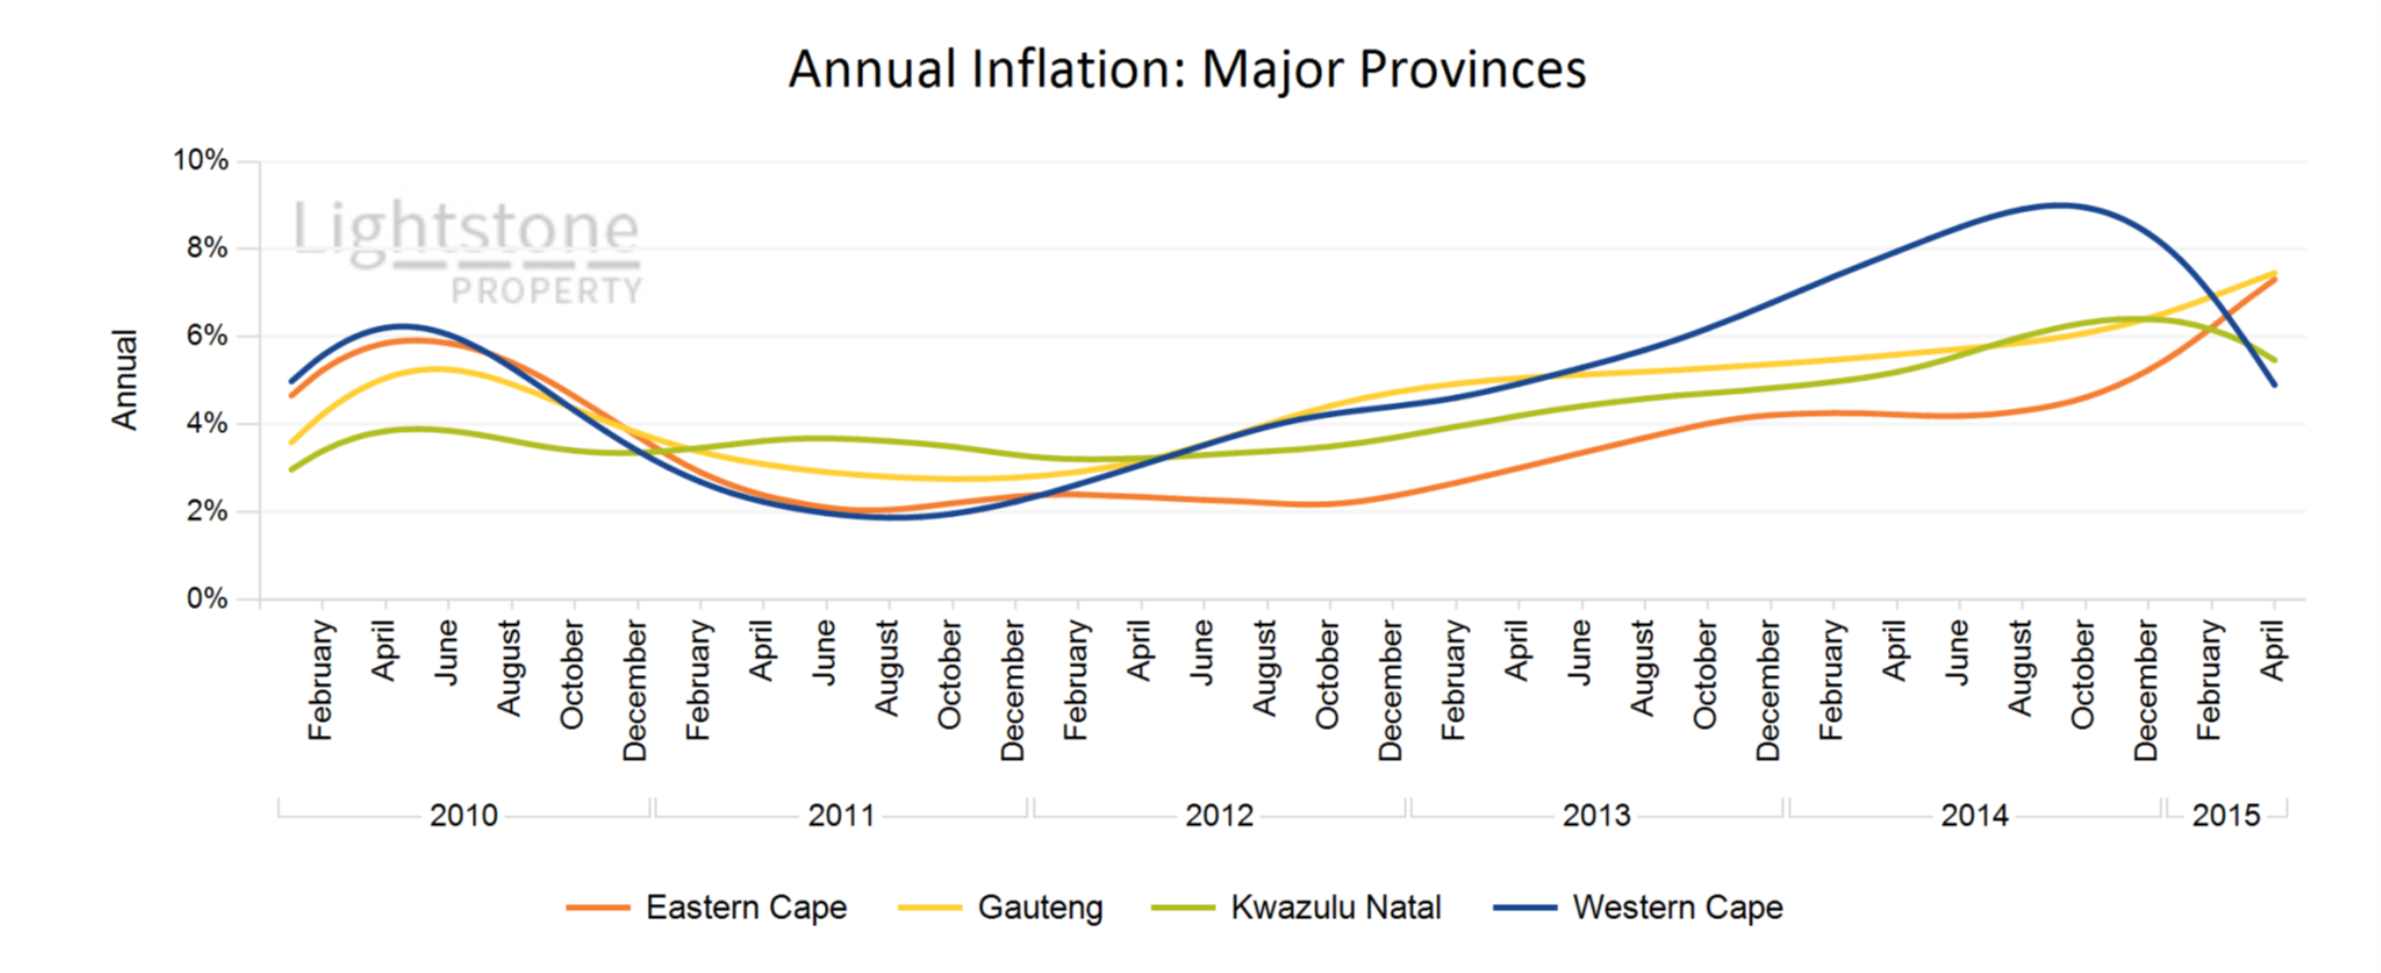
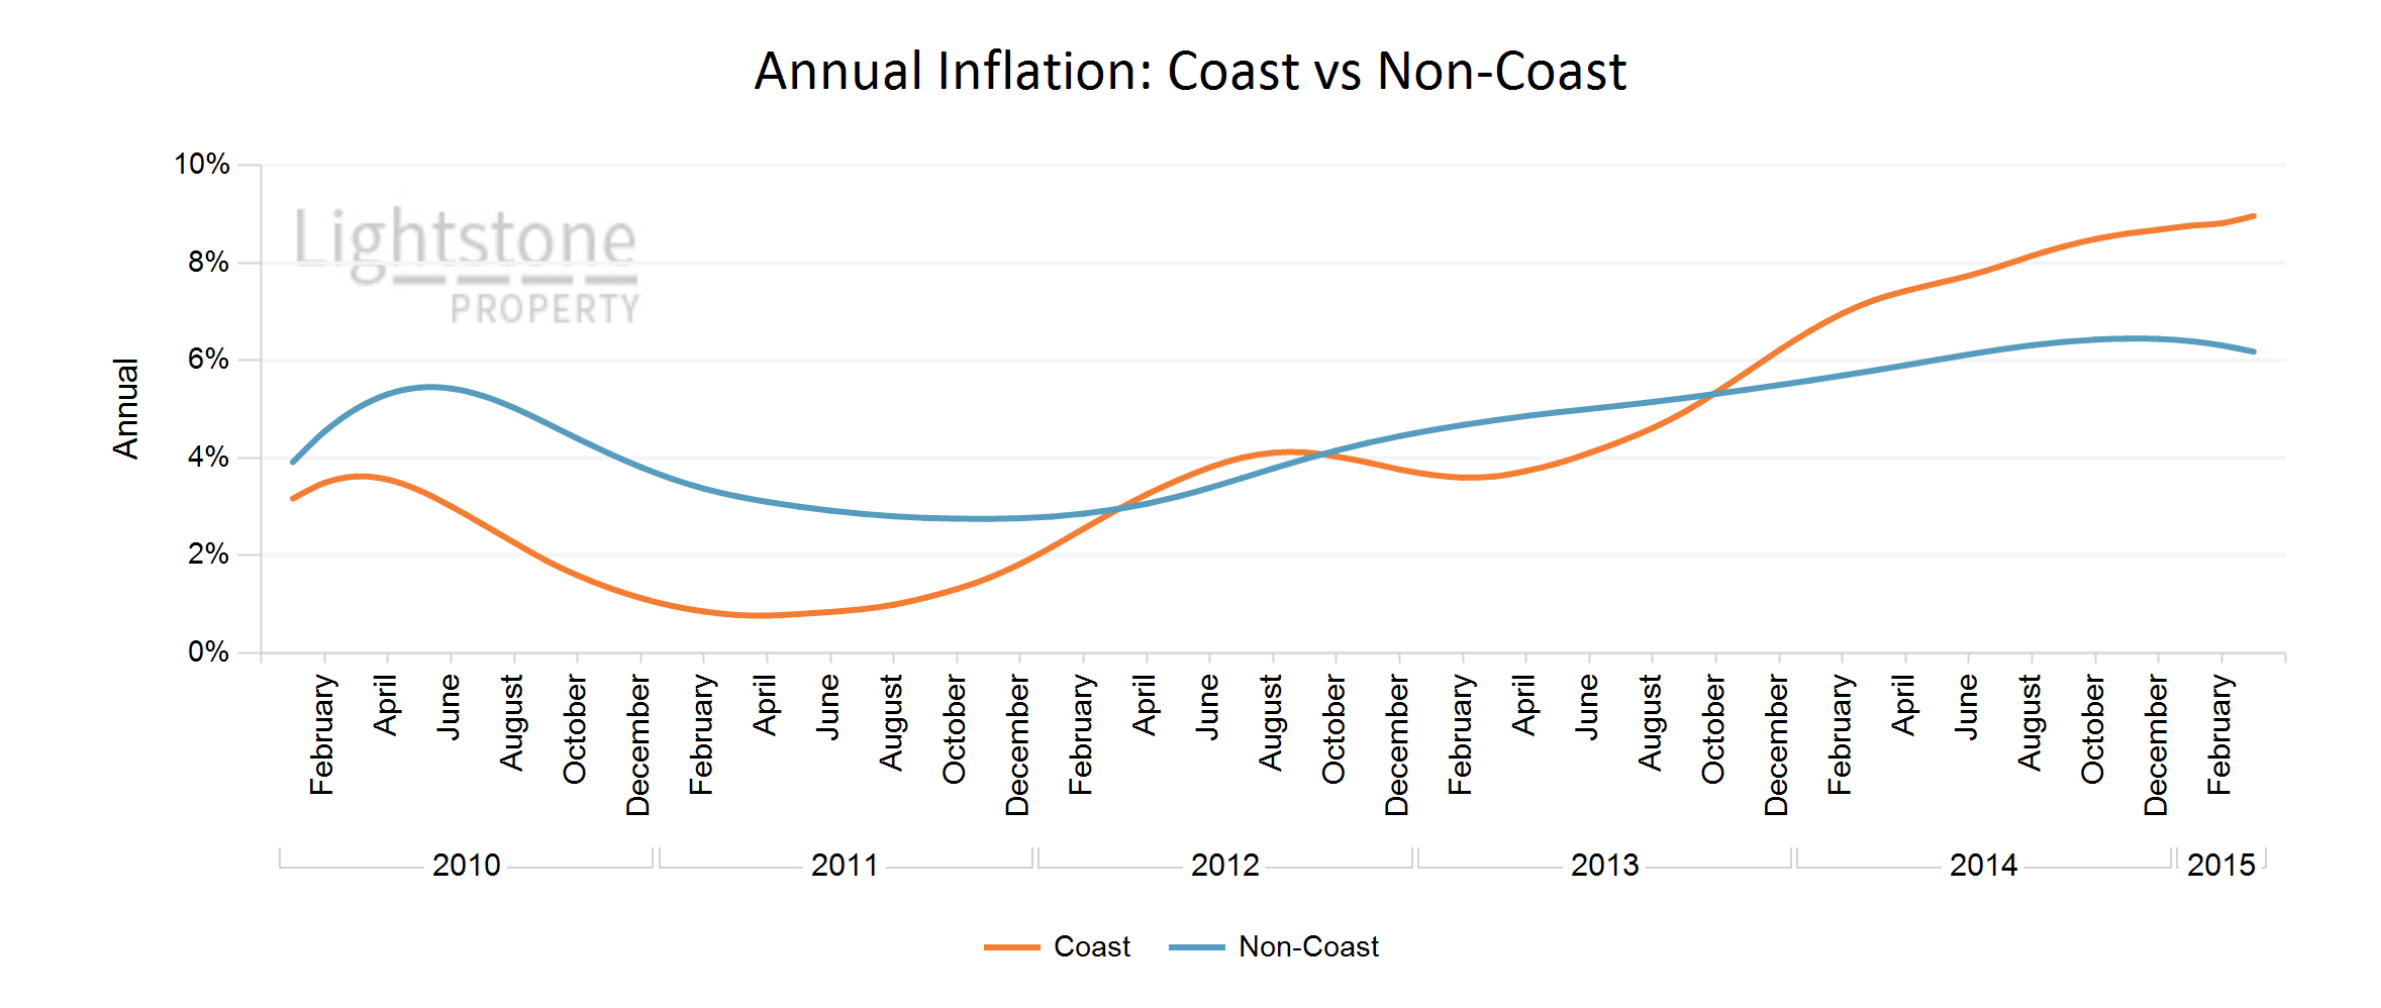
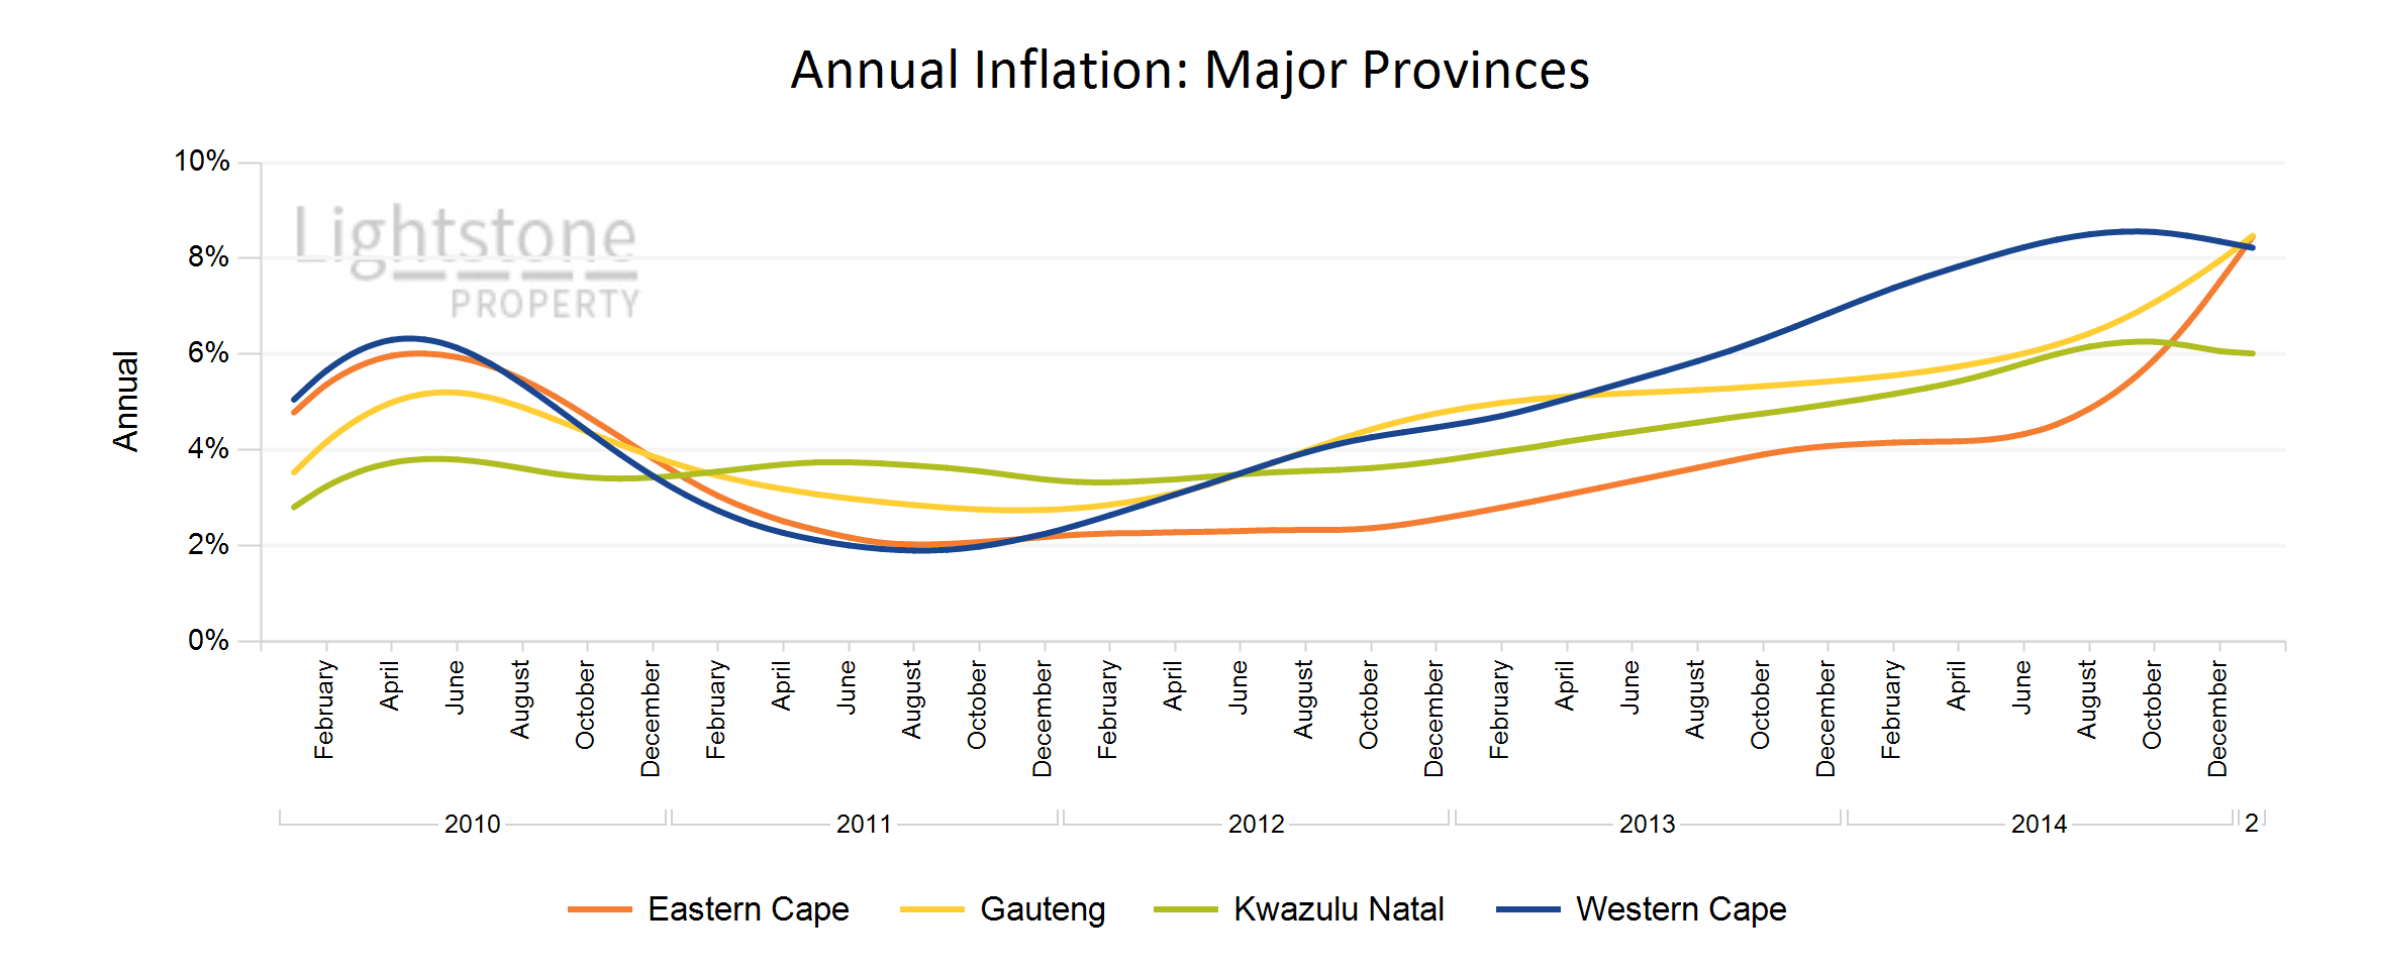
Some meaningful trends have appeared in the South African property market over the past quarter. Some of the most pronounced are the acceleration in house price inflation of properties in the lower and mid value segment and decreases in coastal property inflation. Since the 2008/2009 housing recession all value segments, apart from the low value segment, have grown at roughly the same rate. In the last quarter, annual house price inflation in the mid value segment has increased and is currently at 9.55% while that of the high and luxury segments have remained below the national average of 7.40%. The recorded house price inflation for the luxury value segment was 6.45% in October and decreased from its earlier peak in December 2013.
 October 2014
Year-on-year residential house price inflation was 7.38% nationally, with the low-end affordable market price growth remaining strong. Inflation in the mid-value market segment continues to edge closer to double digits and is starting to mimic the price trends observed in the lower end market. Following Finance Minister Nhlanhla Nenes Medium Term Budget Policy Statement we look forward to seeing the impact of the envisaged investment in dynamic city development on the property market.
September 2014 Residential house prices in SA grew by 7.58% over the last 12 months according to the Lightstone inflation indices. The low value end of the market - a market of increasing interest to mortgage lenders - is continuing to perform well and is currently growing at 14.9% year on year. Early signs create cautious optimism that the mid-value market might be next to break into a more aggressive growth trend as this maket is fed by buyers upgrading out of the lowest tier.
 August 2014
Residential house prices in SA grew by 7.45% over the 12 months ended August 2014 according to the Lightstone inflation indices. This growth is broadly similar across the different provinces and wealth segments with the exception of very low valued properties that continue to grow at around 13.83%. The recent rating agencies downgrade of four of our big home loan lending banks may, however, dampen this buoyant growth. The downgrade will affect the bankscost of funding and subsequently their price offerings and willingness to lend. And we have seen over the last few years that the strong growth in house price inflation has been strongly correlated with an increase in levels of mortgage lending. It may be some time, though, before we see the effect of this trickle through to the market.
 July 2014
The Lightstone National inflation is 7.51 % for July 2014. Even though house price inflation in the different wealth segments usually tends to differ, inflation in the Mid Value, High Value and Luxury segments is growing at a similar rate. The affordable segment is however, against the trend at 16.15%.
 June 2014
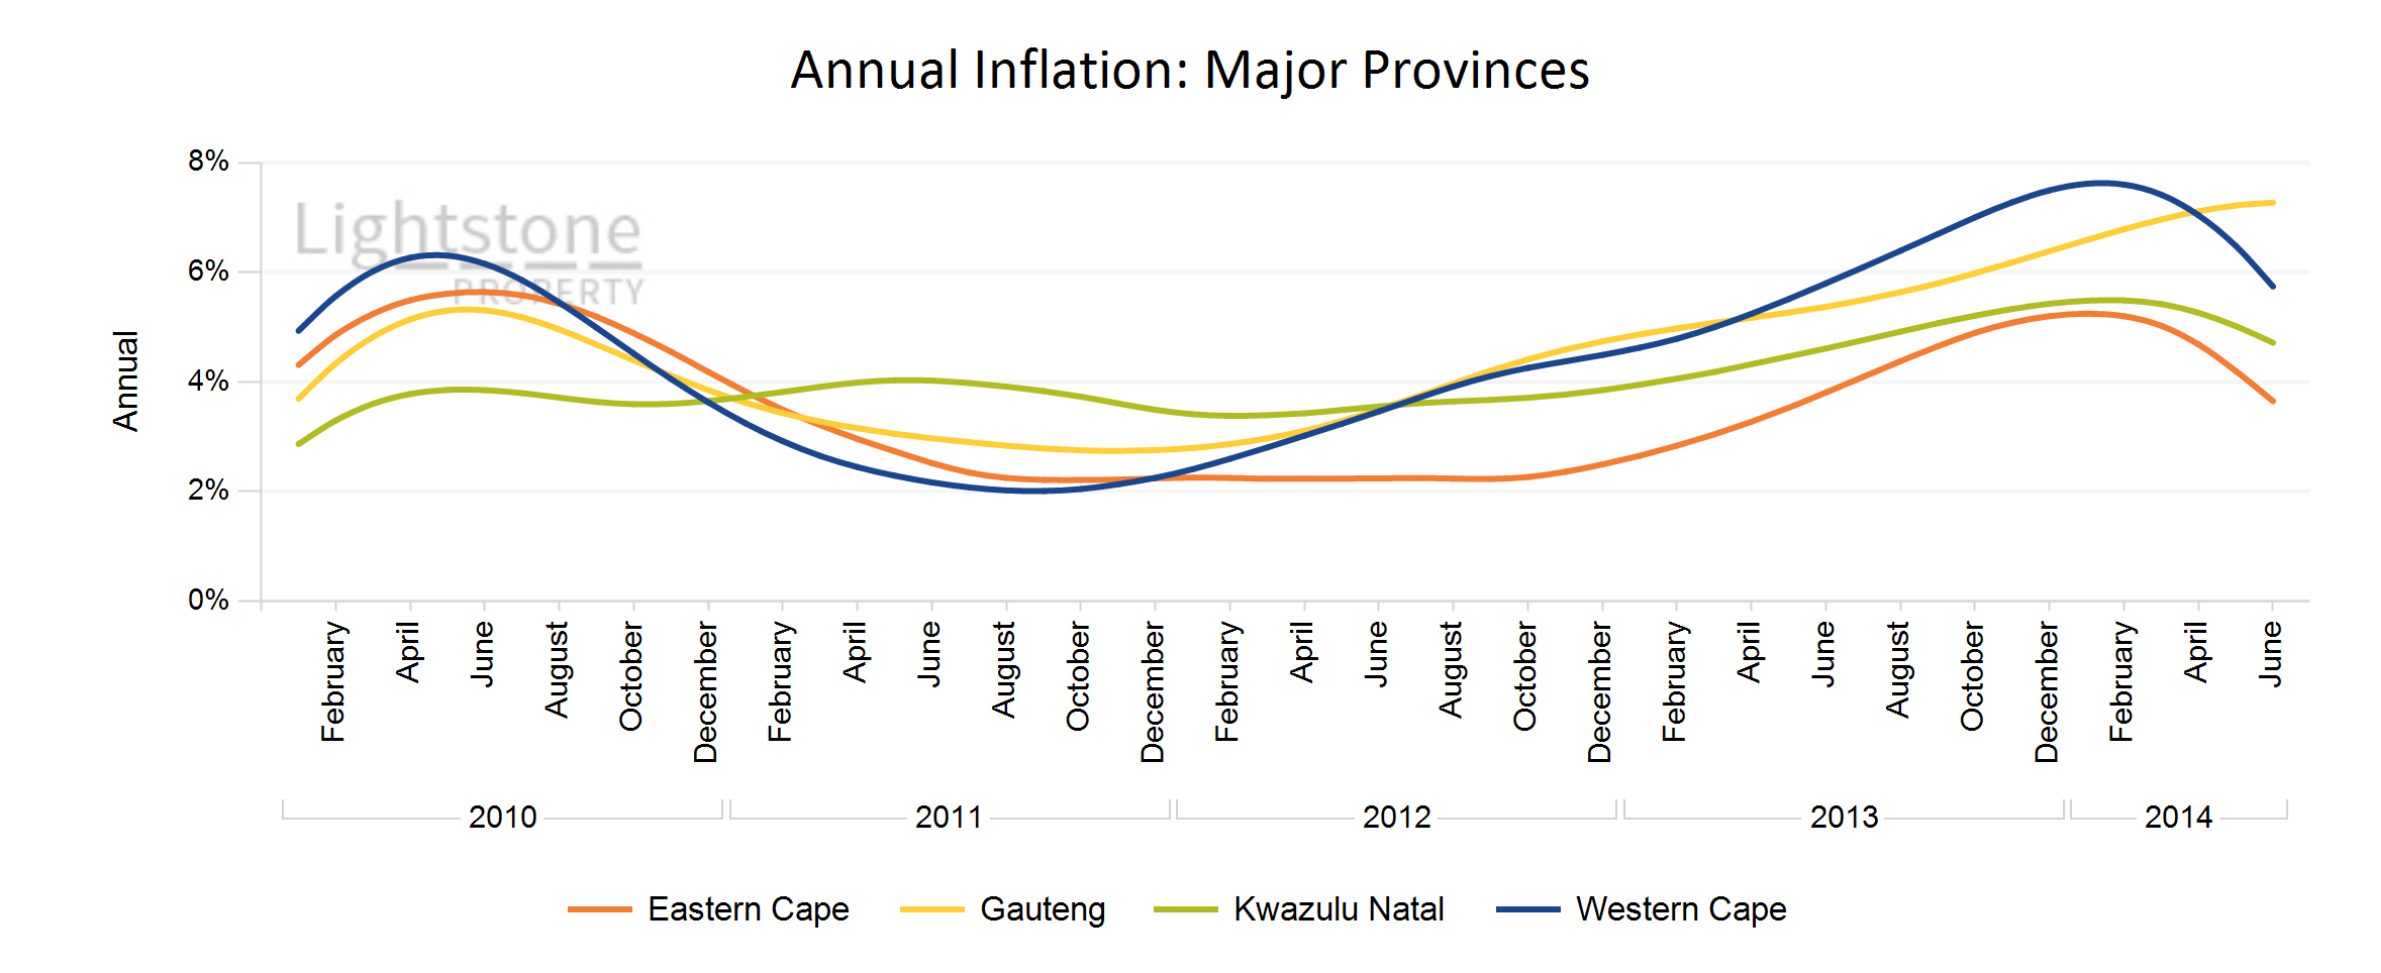
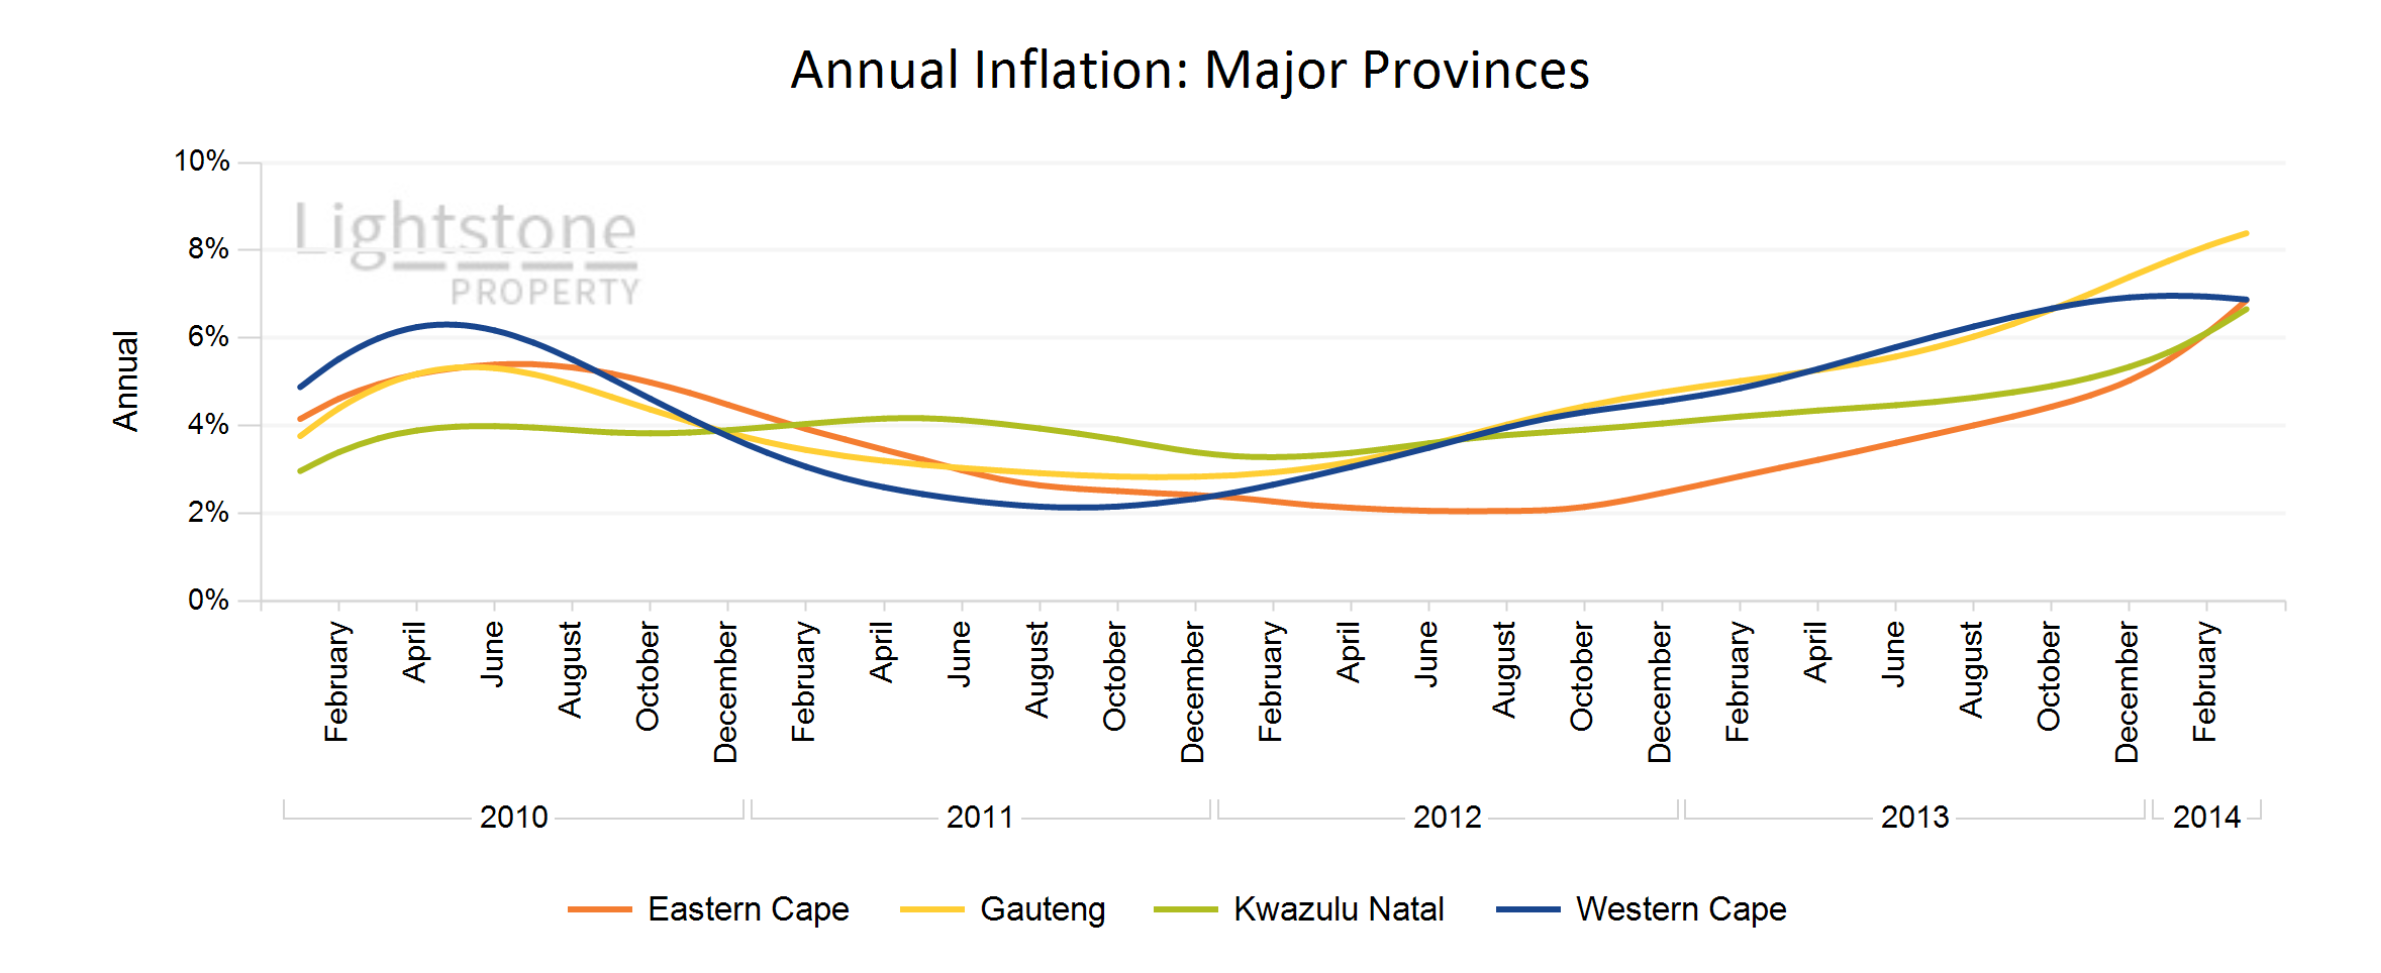
National year-on-year house price inflation is at 7.26%, slightly up from the previous month??s estimate of 7.1%. Growth in the mid value and luxury segments remained relatively stable with growth rates of 8.05 % and 6.88% respectively and the low value segment still outperforms the rest of the market at 14.38%. In addition to strong 9.4% growth in Gauteng where the bulk of property transactions occur, national house price growth is also positively impacted by the double digit inflation experienced in the North West and Northern Cape.